
Someone once used AI to end a relationship in thirty seconds. WLStack Network has spent ten years learning to see where every megabit of bandwidth — every byte — actually goes. A byte may land in the same city, cross a provincial border, shake hands with a peer at an exchange, or set out along a transit line priced per megabit and startlingly expensive. For twenty years, operators’ answer to “where did the traffic go?” has mostly been a guess. Today we have turned that answer into a report you can open at any moment.
I. A Forgotten Question: Where Does the Traffic Go?
The network industry lives with a curious paradox. We know our links’ bandwidth intimately — how many gigabits the port carries, how many gigabits the peak reached, how many gigabits the contract promises — yet we are almost blind to where that traffic flows. SNMP tells us how much a port carried; it does not tell us whether those bits were bound for a neighbor in the same city, a backbone across the province, a rival network, or a peer overseas. And it is direction, not volume, that determines cost.
In an era of cheap bandwidth and simple topologies, that blindness was tolerable. The world has changed. Large-model inference turns compute into tokens, and tokens into a relentless stream of unfamiliar traffic: model weights synchronized across regions, vector stores replicated across borders, uploads and downloads crossing national boundaries, inference requests scheduled between compliant domestic sites and overseas ones. For a token operator running GPU clusters, a BGP backbone and cross-border lines, bandwidth is being promoted from “infrastructure cost” to “the structure of gross margin itself” — and every point of that margin hides inside the distribution of flows.
We entrusted the solving of this class of problem to the WLStack Network Watchdog Network Monitoring and Traffic Analytics Platform.
II. The Operator’s Window
The security industry speaks of “the defender’s window” — a rare stretch of time when new tools arrive before new threats, and whoever sees first stands firm first. The network industry is standing before a similar window right now.
The shape of AI traffic has not yet set. The price systems of cross-province settlement and cross-border peering are being re-valued. The cost model of token operations is still being written. Whoever first turns “flow direction” from vague experience into precise data will judge earlier than their peers on settlement negotiations, peering strategy, capacity planning and product pricing. This window will not stay open forever: once traffic patterns harden and costs are written into long-term contracts, the price of catching up on visibility rises steeply.
Watchdog’s mission is precisely to let operators regain insight and foresight into the foundations of their networks before the window closes — making cost transparent, pricing differentiated, and the network’s value system reforged.
III. Three Cost Chasms
Write the bandwidth cost of one link over one billing period as a simple expression:
C = Σₖ Pₖ · Vₖ
where k ranges over flow categories, Vₖ is the traffic in that category and Pₖ is its unit price. The formula is unremarkable; what is alarming is the gap between the values of Pₖ — the same bit, in different categories, can differ in price by several orders of magnitude. Three chasms open from here.
The first: interconnection within China. In some of China’s economically developed southern provinces — and in remote provinces with weak management and audit capacity, Guangdong and Yunnan in particular — single-city IDC bandwidth has at times reached several terabits, even tens of terabits, sold at rock-bottom prices. The consequences were unbalanced carrier backbones, polarized traffic, group-level IDC price controls reduced to paper, and ultimately the rise of intra-carrier cross-province settlement, cross-city settlement, and a re-settlement of the interconnection backbones that the Ministry of Industry and Information Technology had spent decades improving — economic levers deployed to steer traffic back into balance. On-net versus off-net, local city versus cross-city versus cross-province: each corresponds to sharply different backbone costs and inter-network settlement rules. A provincial carrier that cannot distinguish “on-net · local city” from “off-net · cross-province” cannot explain why the same port peak produces a different bill every month. An ISP agent that cannot see how its customers’ traffic is distributed cannot set prices that are both fair and profitable — and, worse, steep settlement charges drive carriers to terminate, or refuse, cooperation with that agent altogether.
The second: peering versus transit at domestic and overseas exchanges. Peering completed at an exchange carries a marginal cost close to zero; every megabit that rides transit is real money, and in many markets the price gap between the two is an order of magnitude. The single most valuable piece of knowledge an operator can hold is how much traffic that ought to be peered is paying for transit — and which ASNs, which countries and regions, which ports and protocols it comes from.
The third: compute and token operations. Once inference services redistribute traffic by customer, by region and by site, bandwidth cost stops being a single total and becomes a ledger that must be reconciled customer by customer, line by line. A token operator that cannot see attribution either spreads cost evenly across all customers and loses its competitive edge, or unknowingly subsidizes a handful of heavy-traffic customers.
The fourth gate: what are carriers to do?
Carriers have partners and supporting vendors. They add devices and line cards, buy software and services, all to raise the operations layer’s visibility into traffic. Yet building costs money and going live takes time. Address libraries are imprecise — in one province, a carrier applied a blanket rule that classified every IP range a cloud provider announced over BGP with that carrier as cross-province traffic and throttled it, leaving customers with frequent origin-fetch failures and endless settlement disputes. Platforms that absorbed enormous investment still depend on people importing and exporting reports by hand; even customers’ source address ranges are keyed in manually, leaving room for what slips through the net — or for interests quietly transferred. And the platforms that do get built are confined to “restriction”, rather than serving bandwidth and traffic operations with decision support, differentiated cost auditing and customer pricing — the rebuilding of a value system.
Worse still, in corners where carriers’ oversight lapses, a few disreputable agents engage in the following schemes:
- Some exploit carriers’ missing uRPF source-address validation, separating inbound and outbound routes and using overseas addresses to evade settlement in certain provinces.
- Some apply for small-bandwidth BGP ports and — with an insider’s help or by exploiting lax review — statically route their BGP prefixes onto large IDC interconnect bandwidth: paying small-BGP costs while pulling cross-province traffic inbound and pushing large cross-province bandwidth outbound, evading settlement.
The tricks are endless. They are neither lawful nor the right road for traffic and bandwidth operations.
There is only one core solution: insight and foresight. First make sure you can see, see clearly and see completely; then support decisions, price differentially, deconstruct bandwidth cost, and reforge the value system.
IV. Watchdog’s Answer: From Seeing to Control
Watchdog is a self-hosted, single-domain, all-in-one monitoring and traffic analytics platform. It gathers host and container system metrics, SNMP telemetry from network devices, and sFlow / NetFlow / IPFIX flow data into one address library, one classification standard, and one system of permissions and audit. Here is how it answers “where did the traffic go?”
1. One View of the Whole Foundation
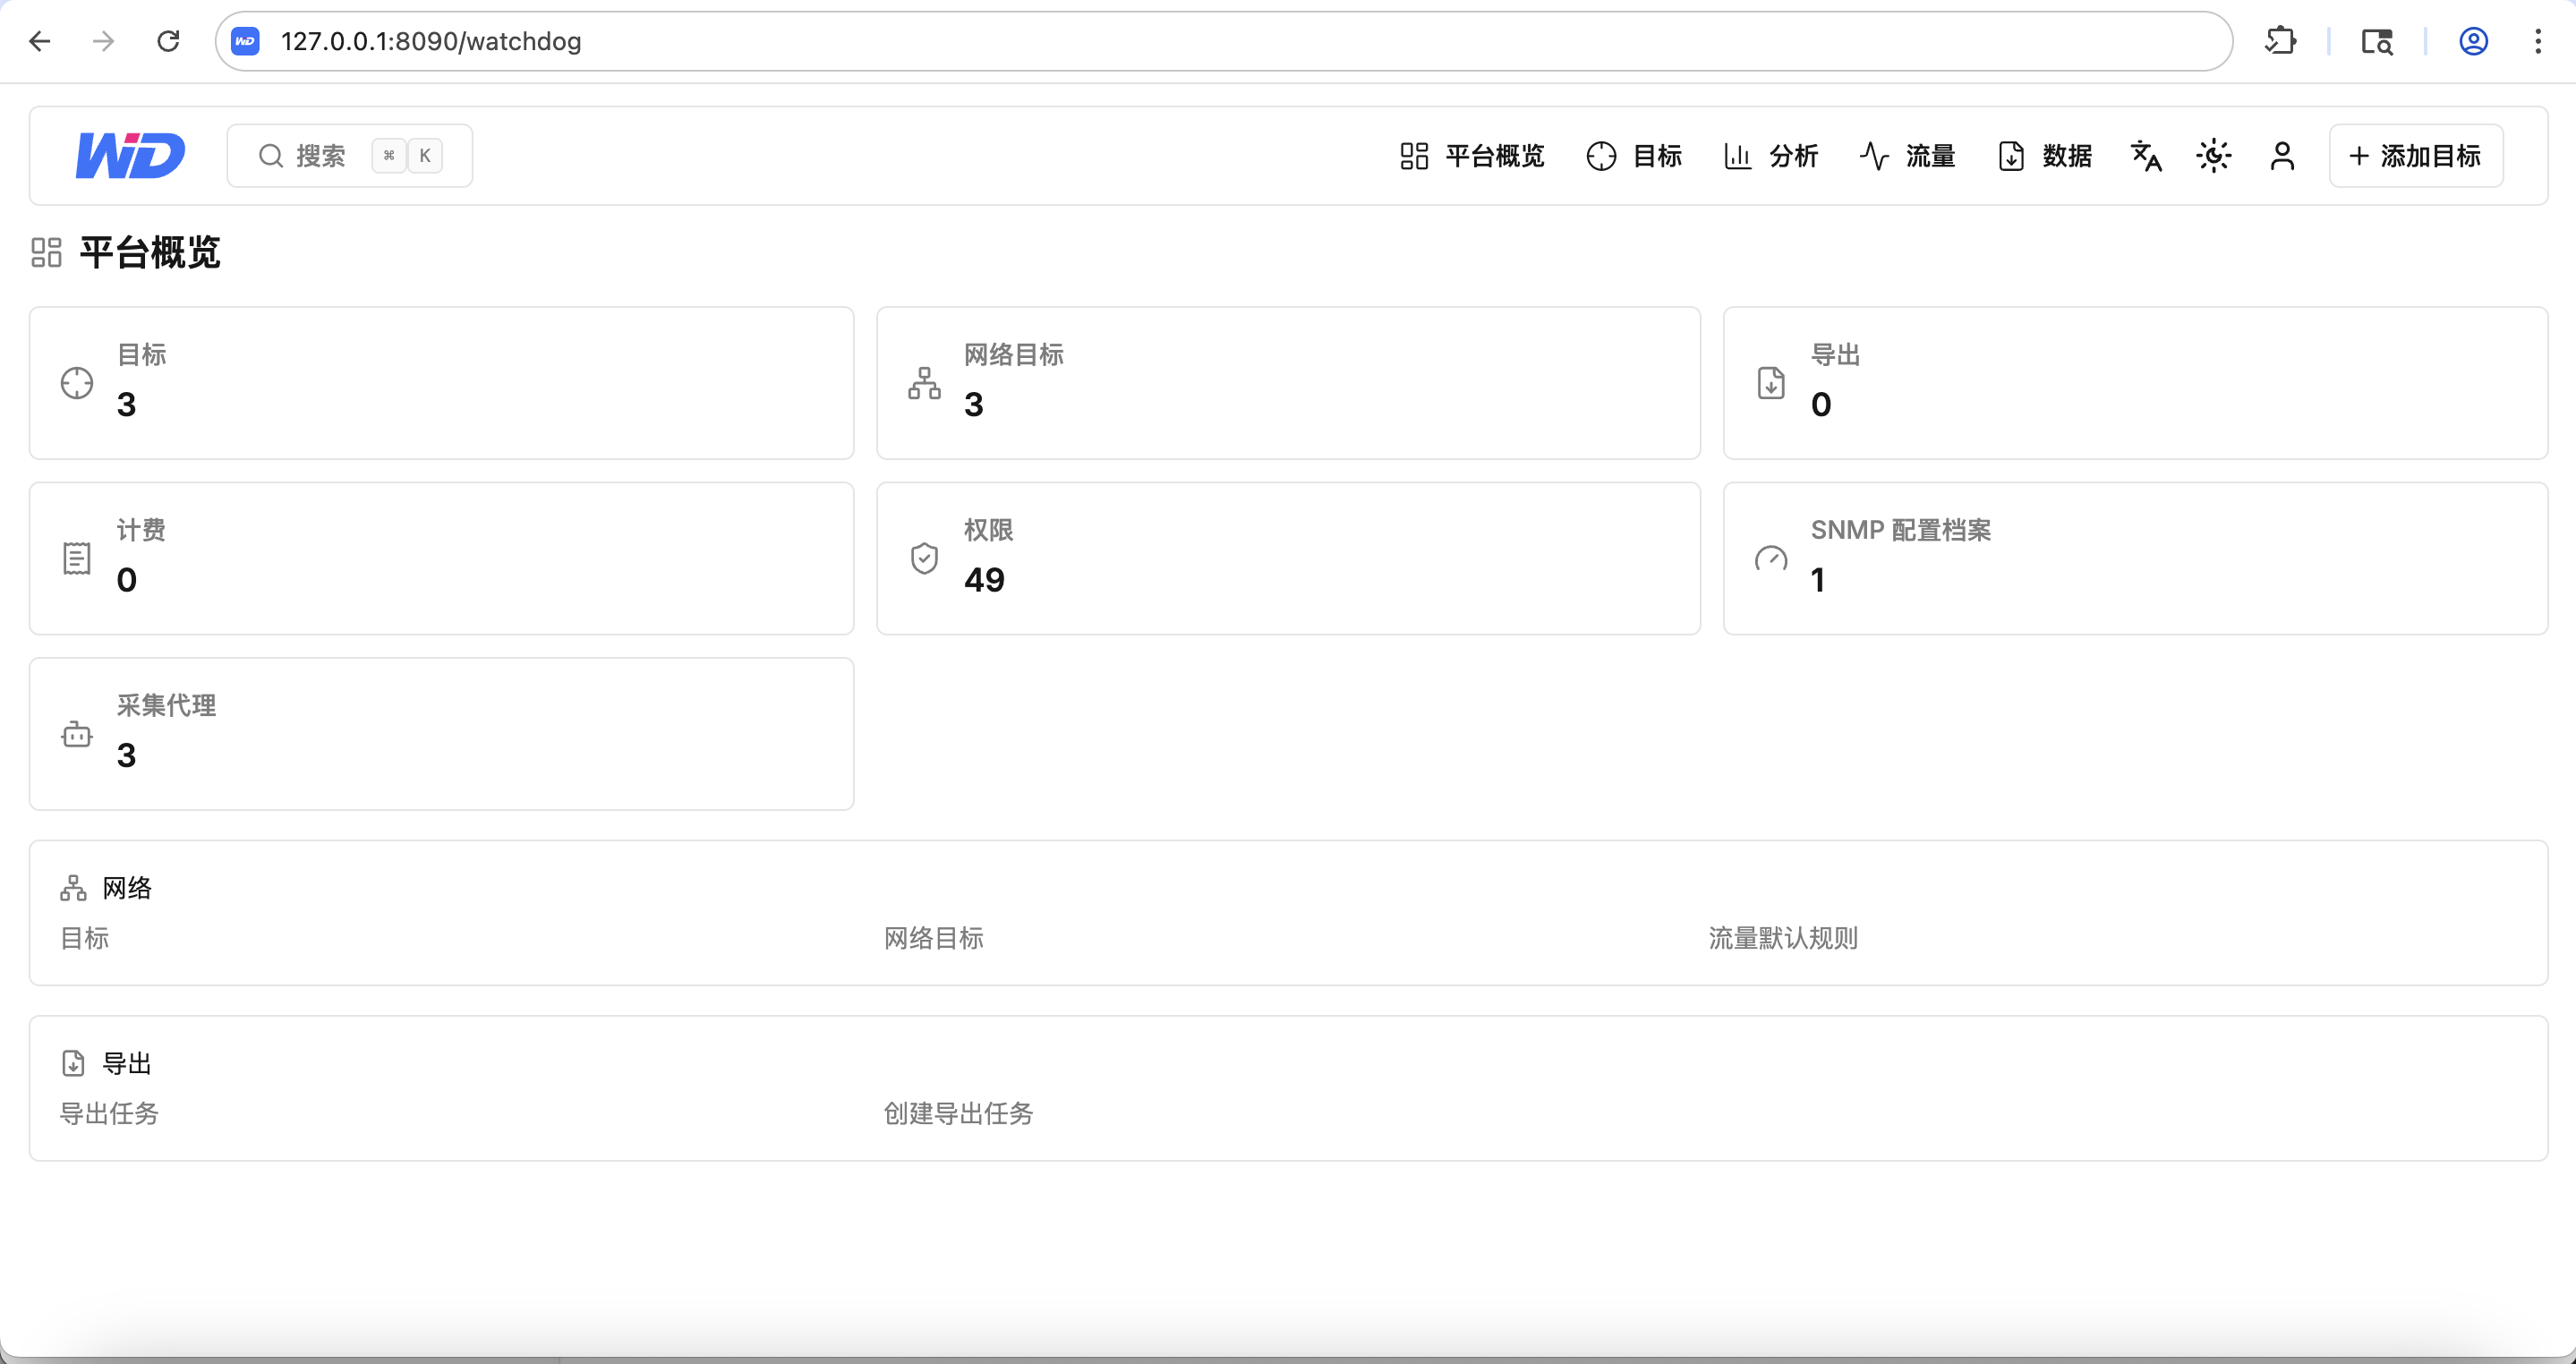
After sign-in, the platform overview brings monitoring targets, network targets, exports, billing, permissions, SNMP profiles and collection agents together on one screen — the unified starting point for every module.
2. Devices and Ports: Starting from “How Much Did It Carry”
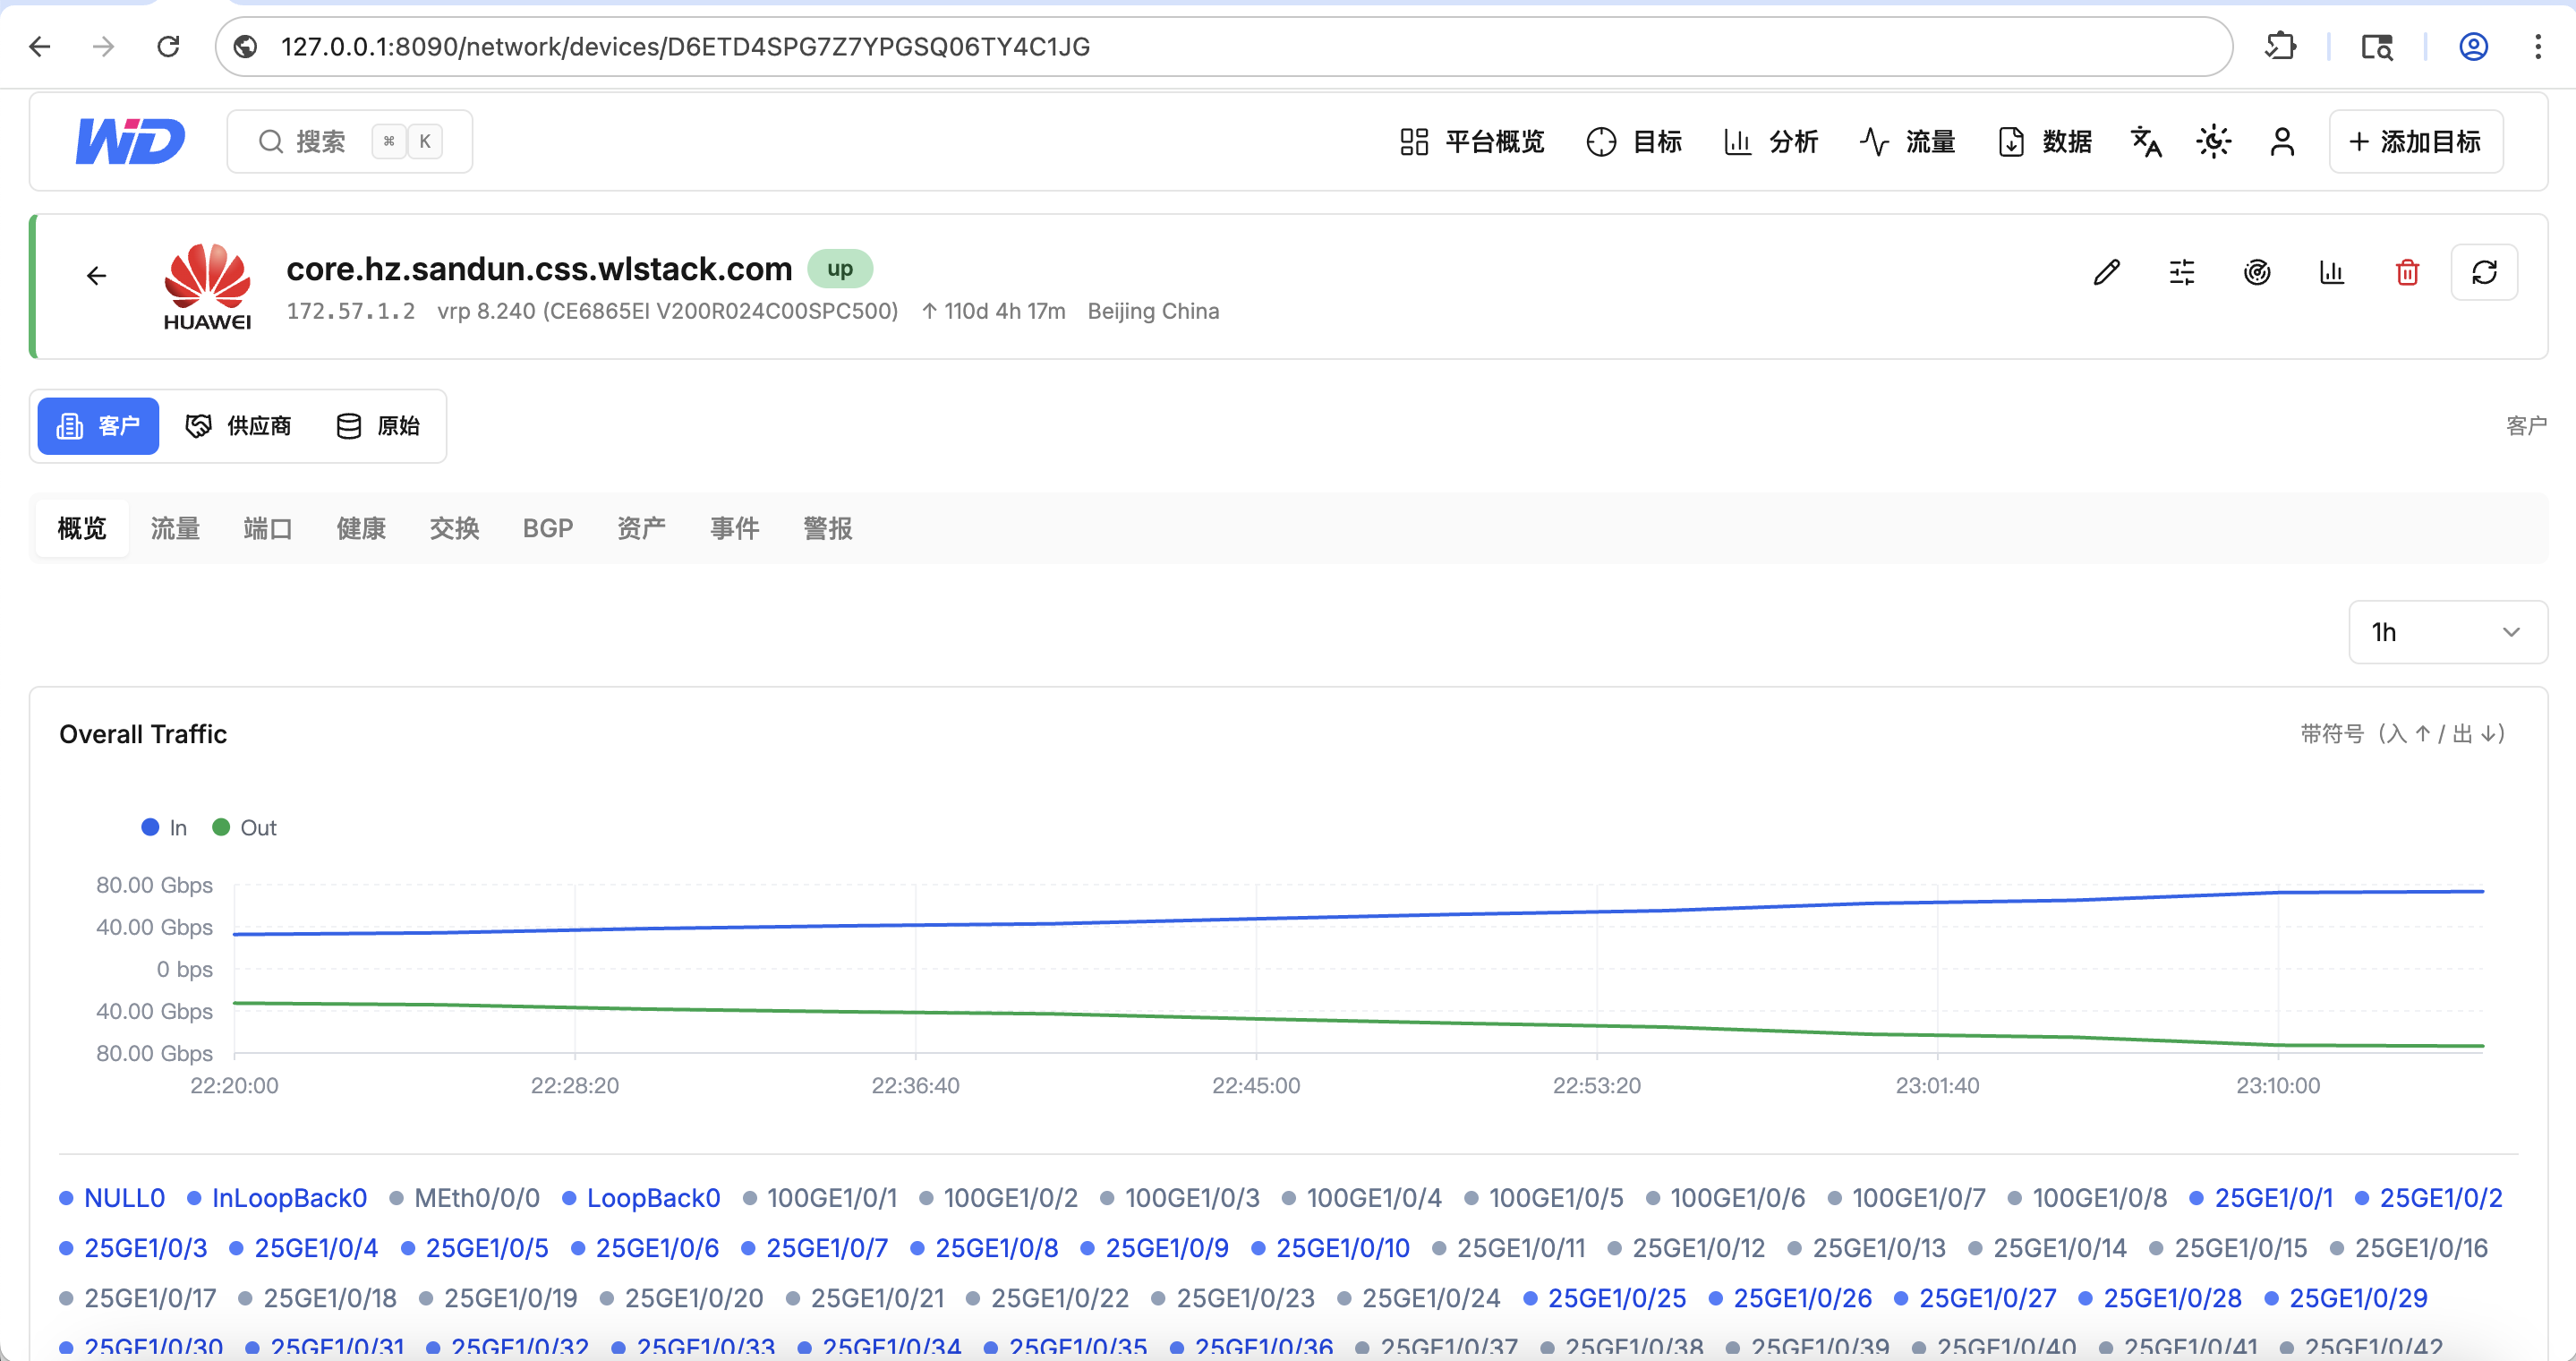
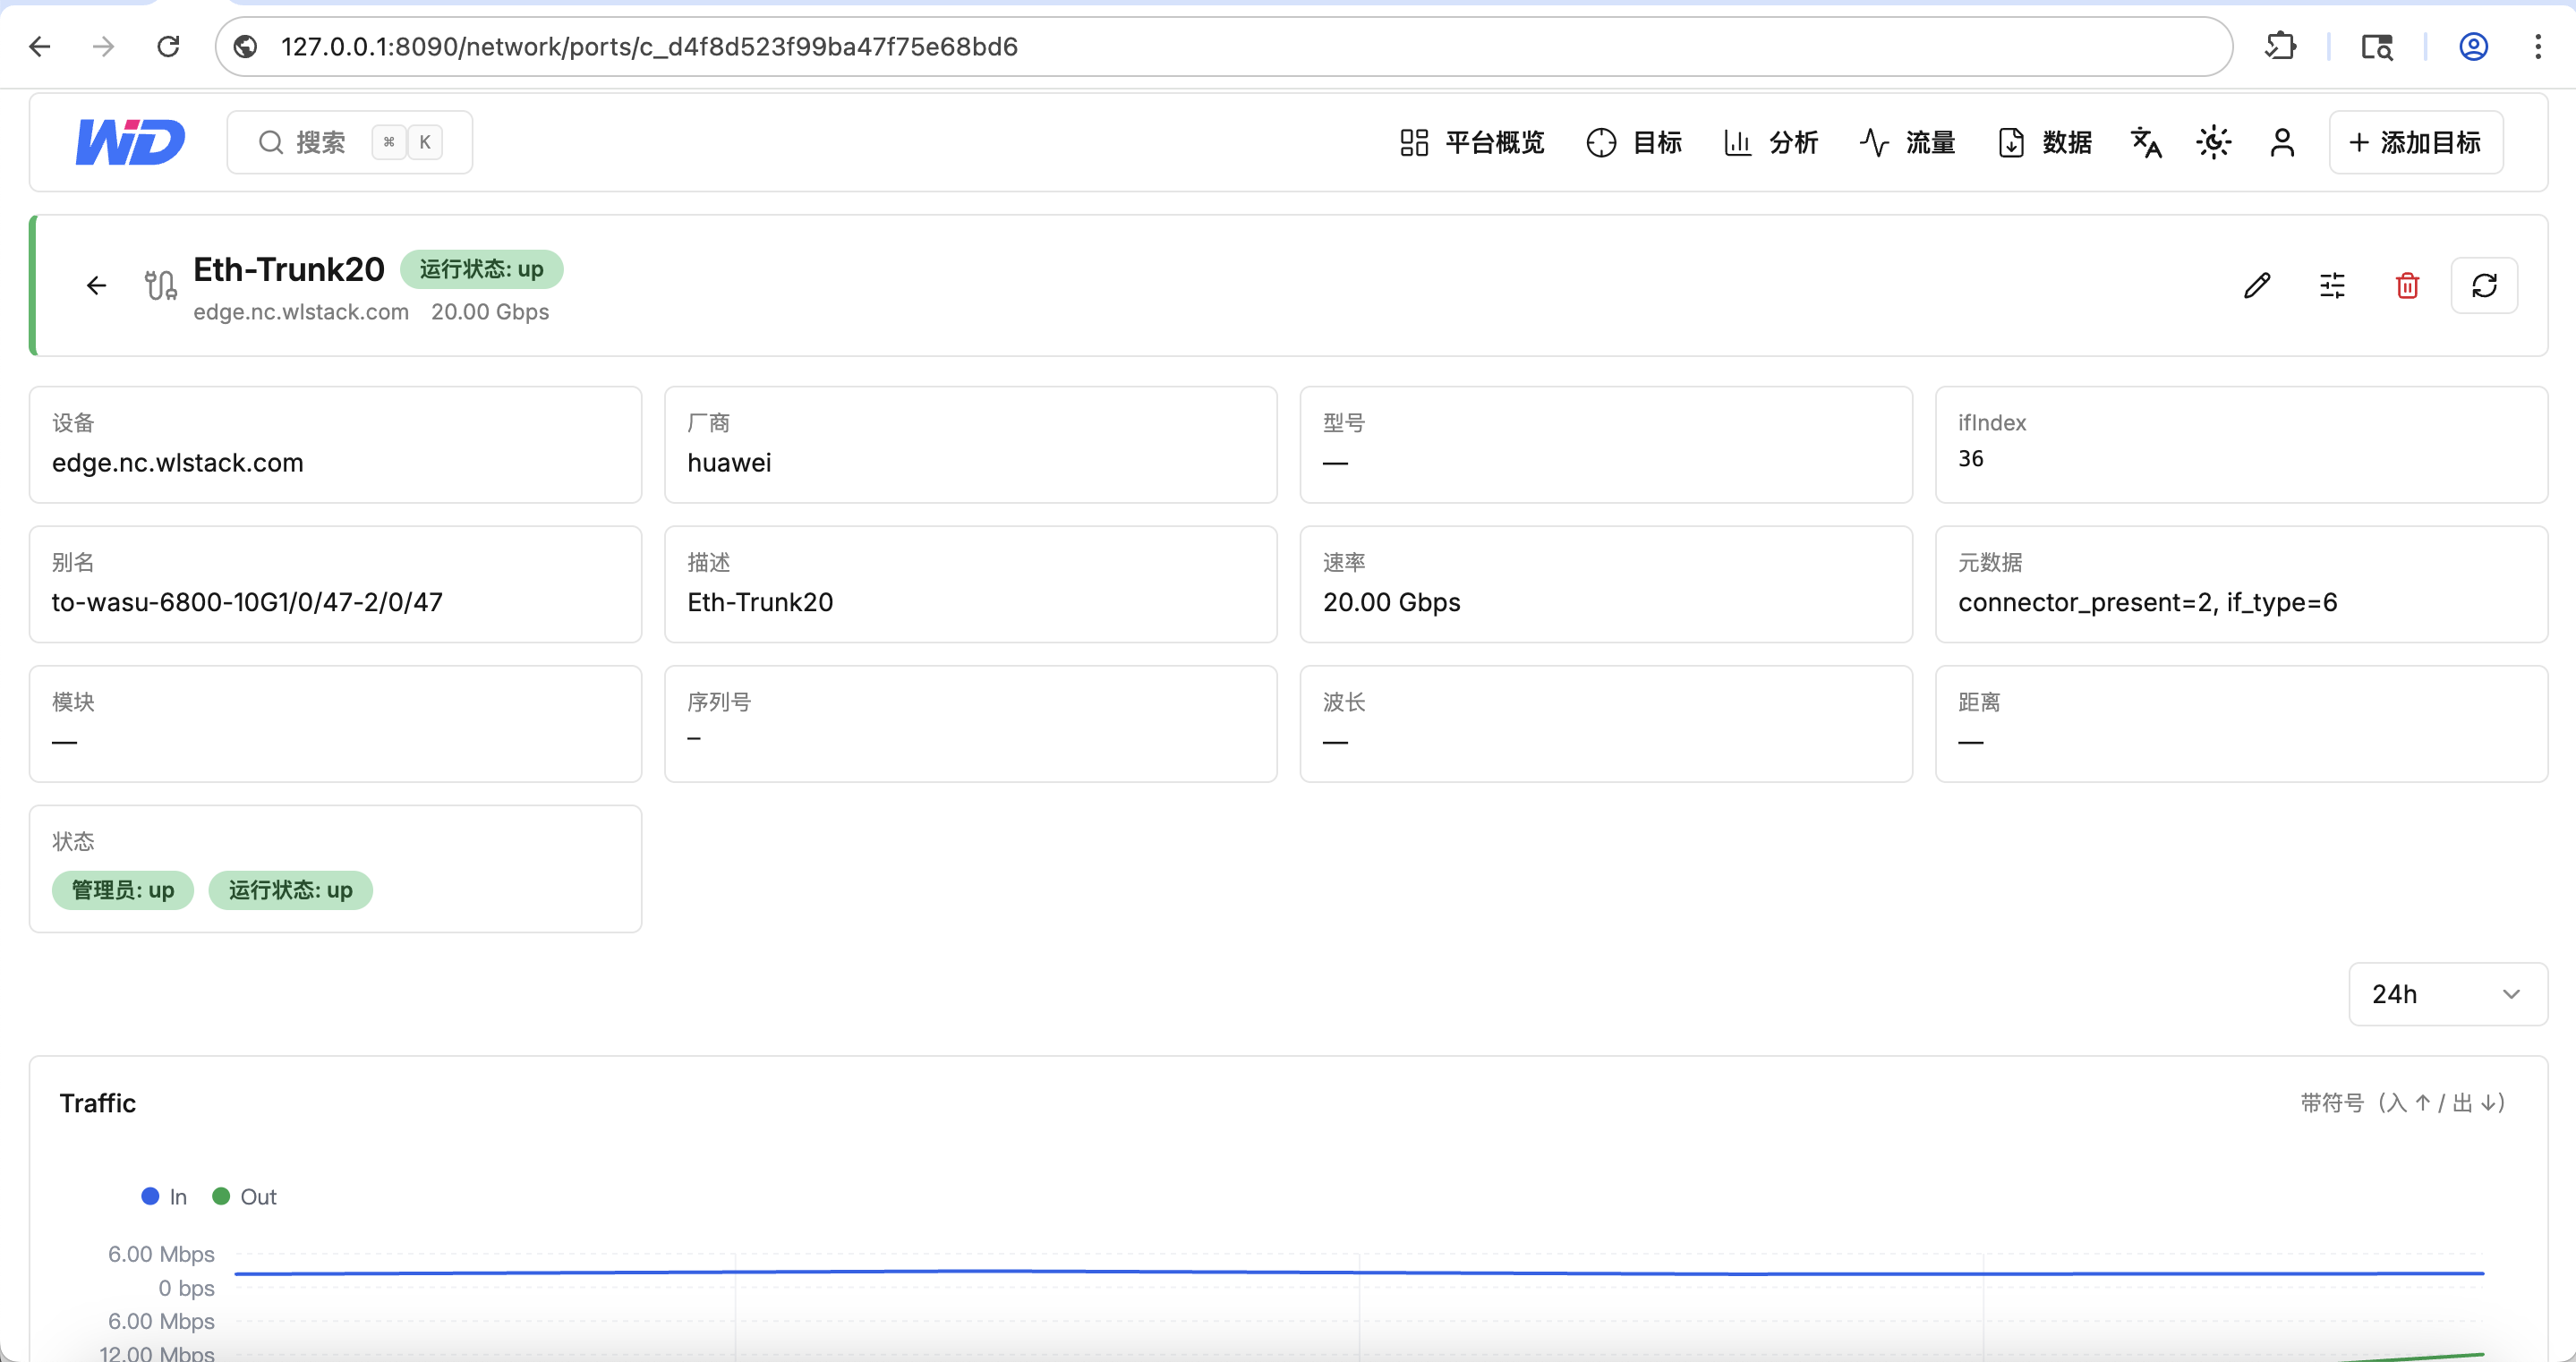
Network devices are registered through SNMP profiles (v1/v2c/v3), then discovered and collected automatically. Device detail is organized into overview, traffic, ports, health, switching, BGP, assets, events and alerts; the port list can be searched by name, alias and status; port detail shows alias, description, speed and inbound/outbound trends. More importantly, every chart can be switched among customer / supplier / raw valuation views — for the same link, whose view you measure by is itself a central question of settlement.
3. Six Flow Classes: Engraving Settlement Rules into Traffic
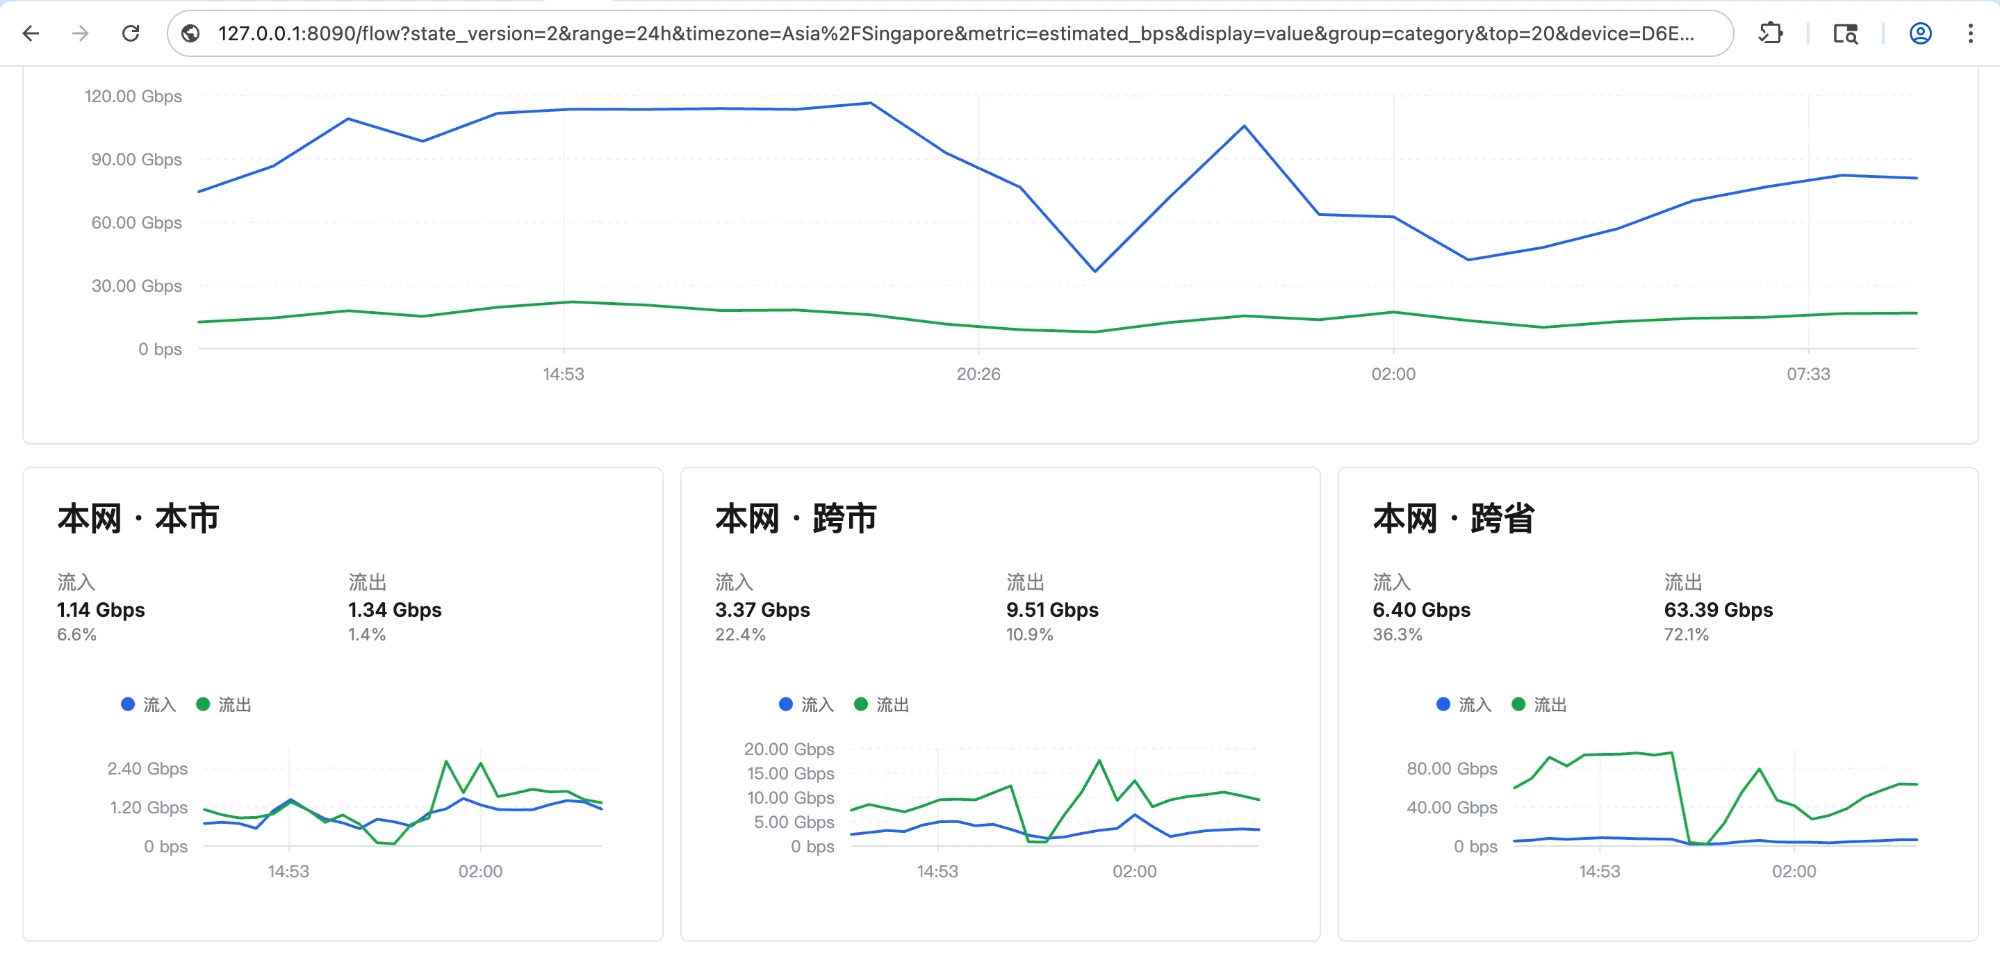
This is the heart of Watchdog. Every flow record is enriched from the address library at ingestion and placed into one of six classes — on-net · local city, on-net · cross-city, on-net · cross-province, off-net · in-province, off-net · cross-province, and cross-border — with inbound and outbound direction marked. The traffic overview first shows total inbound and outbound from the local network’s perspective, then lays out each class’s inbound/outbound rate and share as cards. For the first time, an operator can see every Vₖ of the cost function on a single screen.
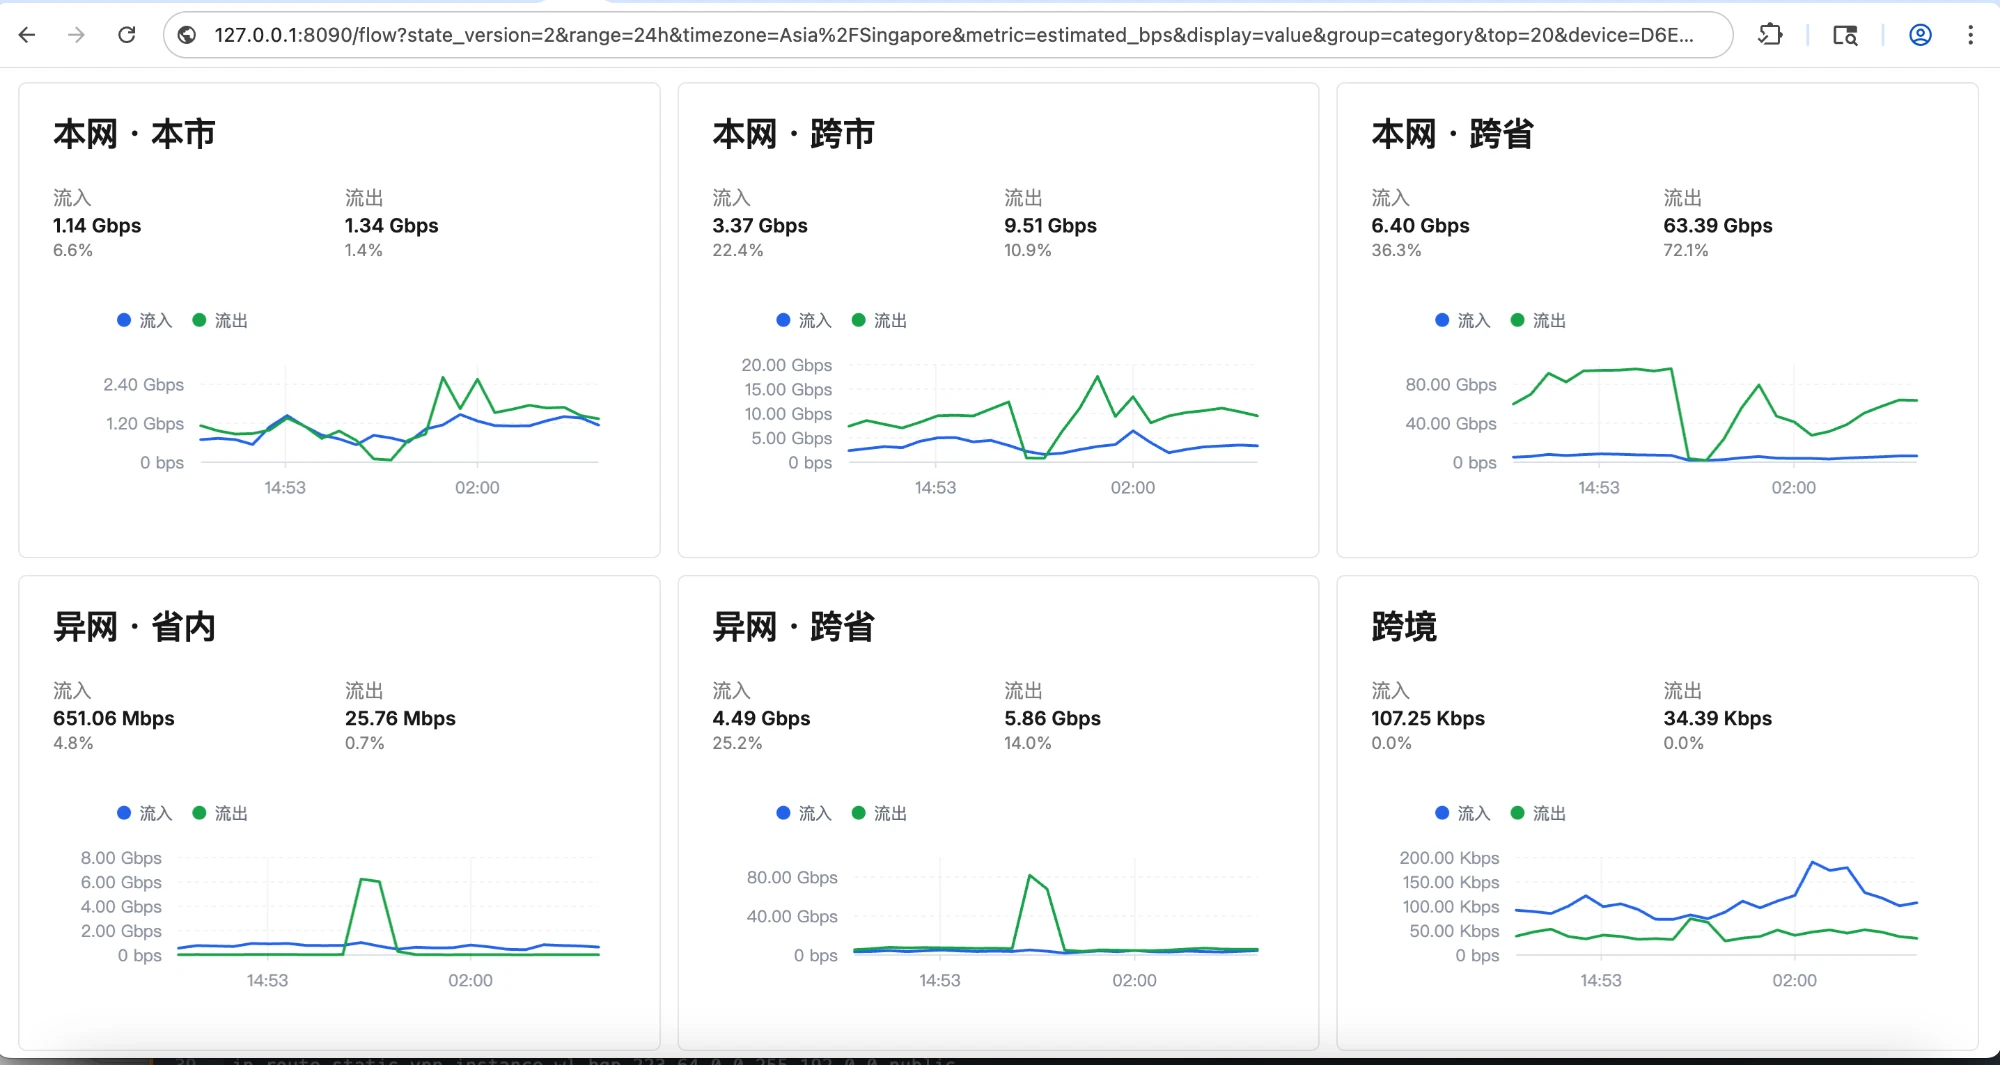
4. Multi-Dimensional Analysis: Asking by Province, by Carrier, by Country
Six classes are only the first layer. Multi-dimensional analysis lets the same traffic be unfolded layer by layer — on-net by province, on-net in-province by city, off-net by carrier, cross-border by country/region, unidentified by destination prefix or destination IP — with each layer showing inbound and outbound time series, current value, 95th percentile, peak and average. Disputes over cross-province settlement, imbalances in off-net interconnection, the sources of cross-border traffic: all of them acquire evidence that can be named.
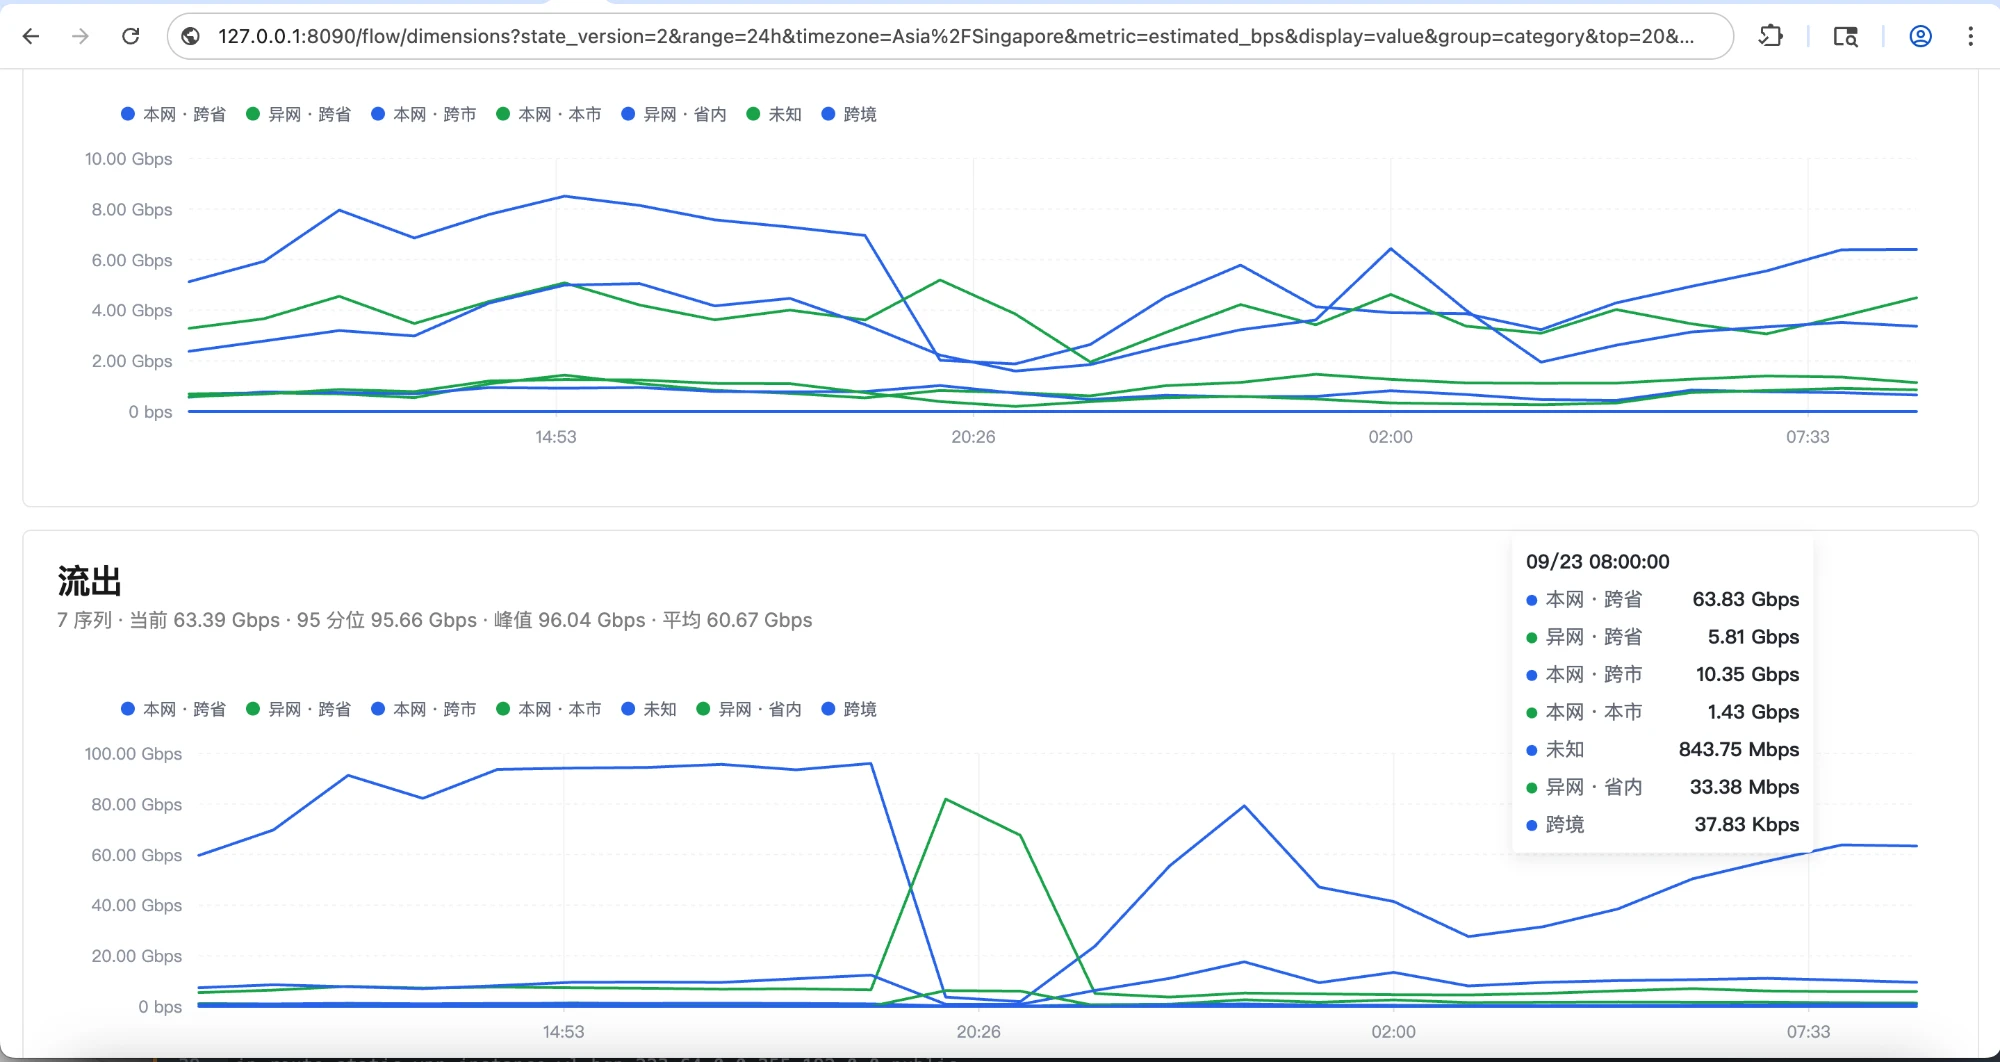
5. Who Is Consuming: Source and Destination IP Analysis
High-traffic IP addresses are ranked by total volume, each showing current, average, 95th percentile, peak and six-class breakdown. You can drill down to individual flow records (time, source and destination, protocol, direction, class, remote ASN, country, estimated volume and sampling rate) and correct attribution on the spot — corrections become address-library drafts rather than silently altering a published snapshot.
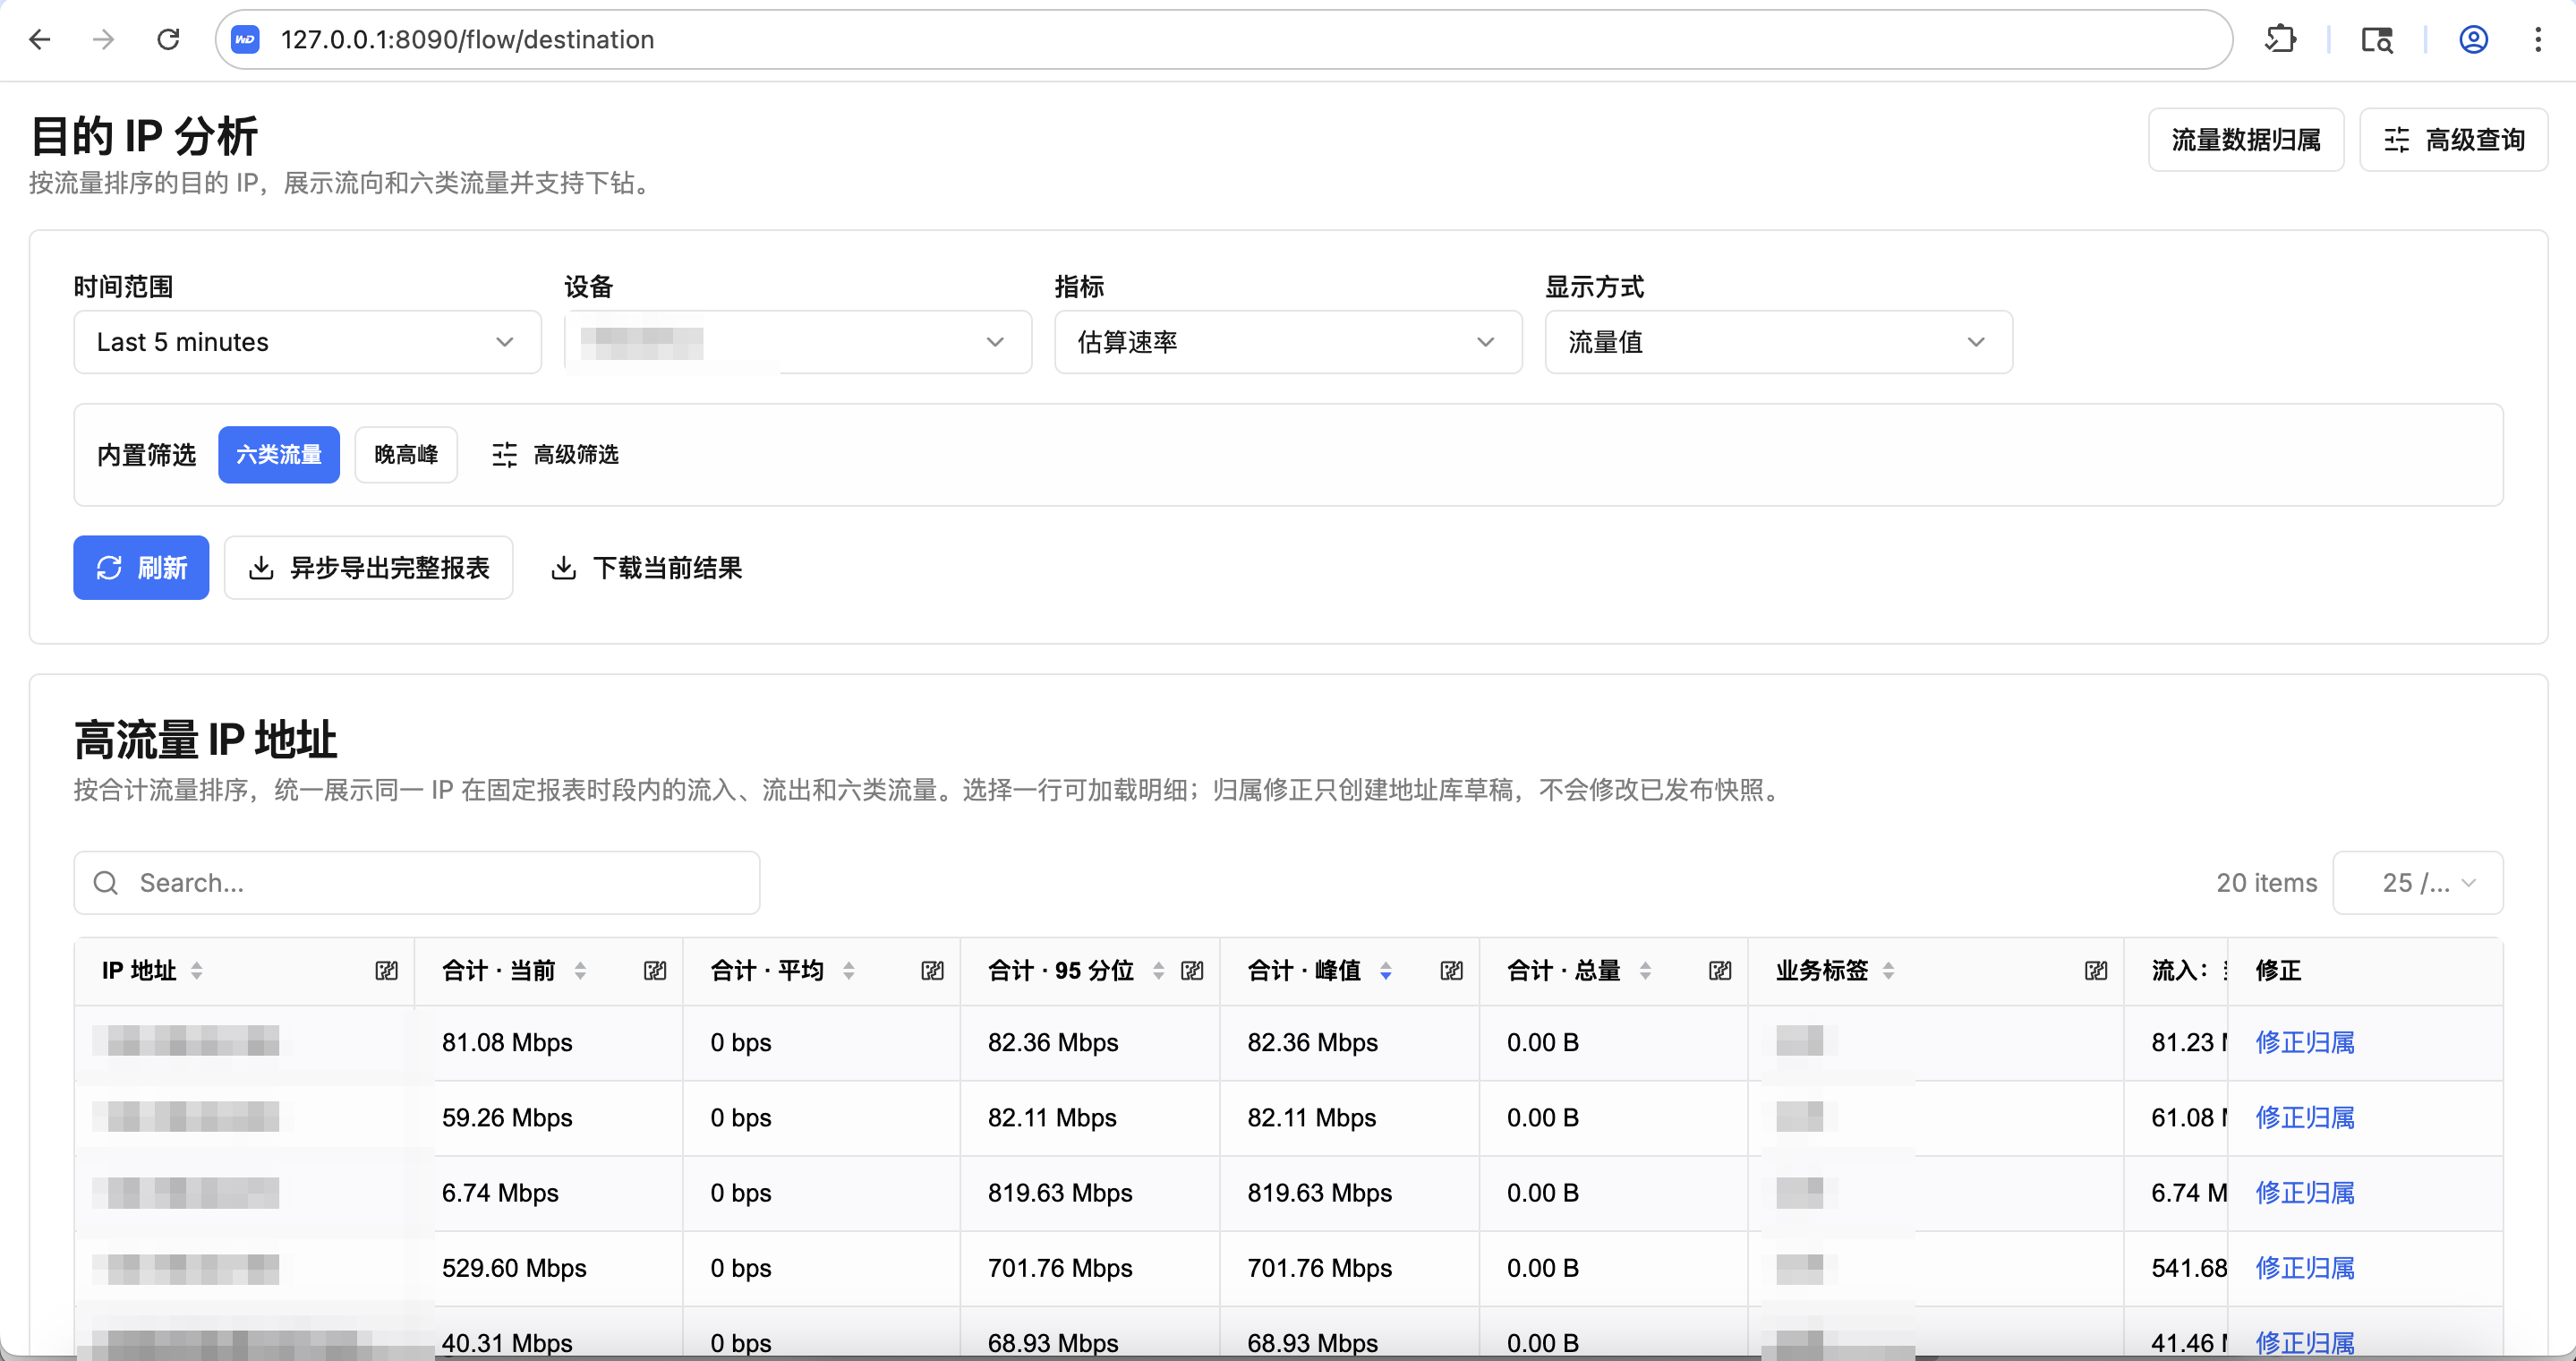
6. Cross-Border Traffic: The Ledger of Peering and Transit
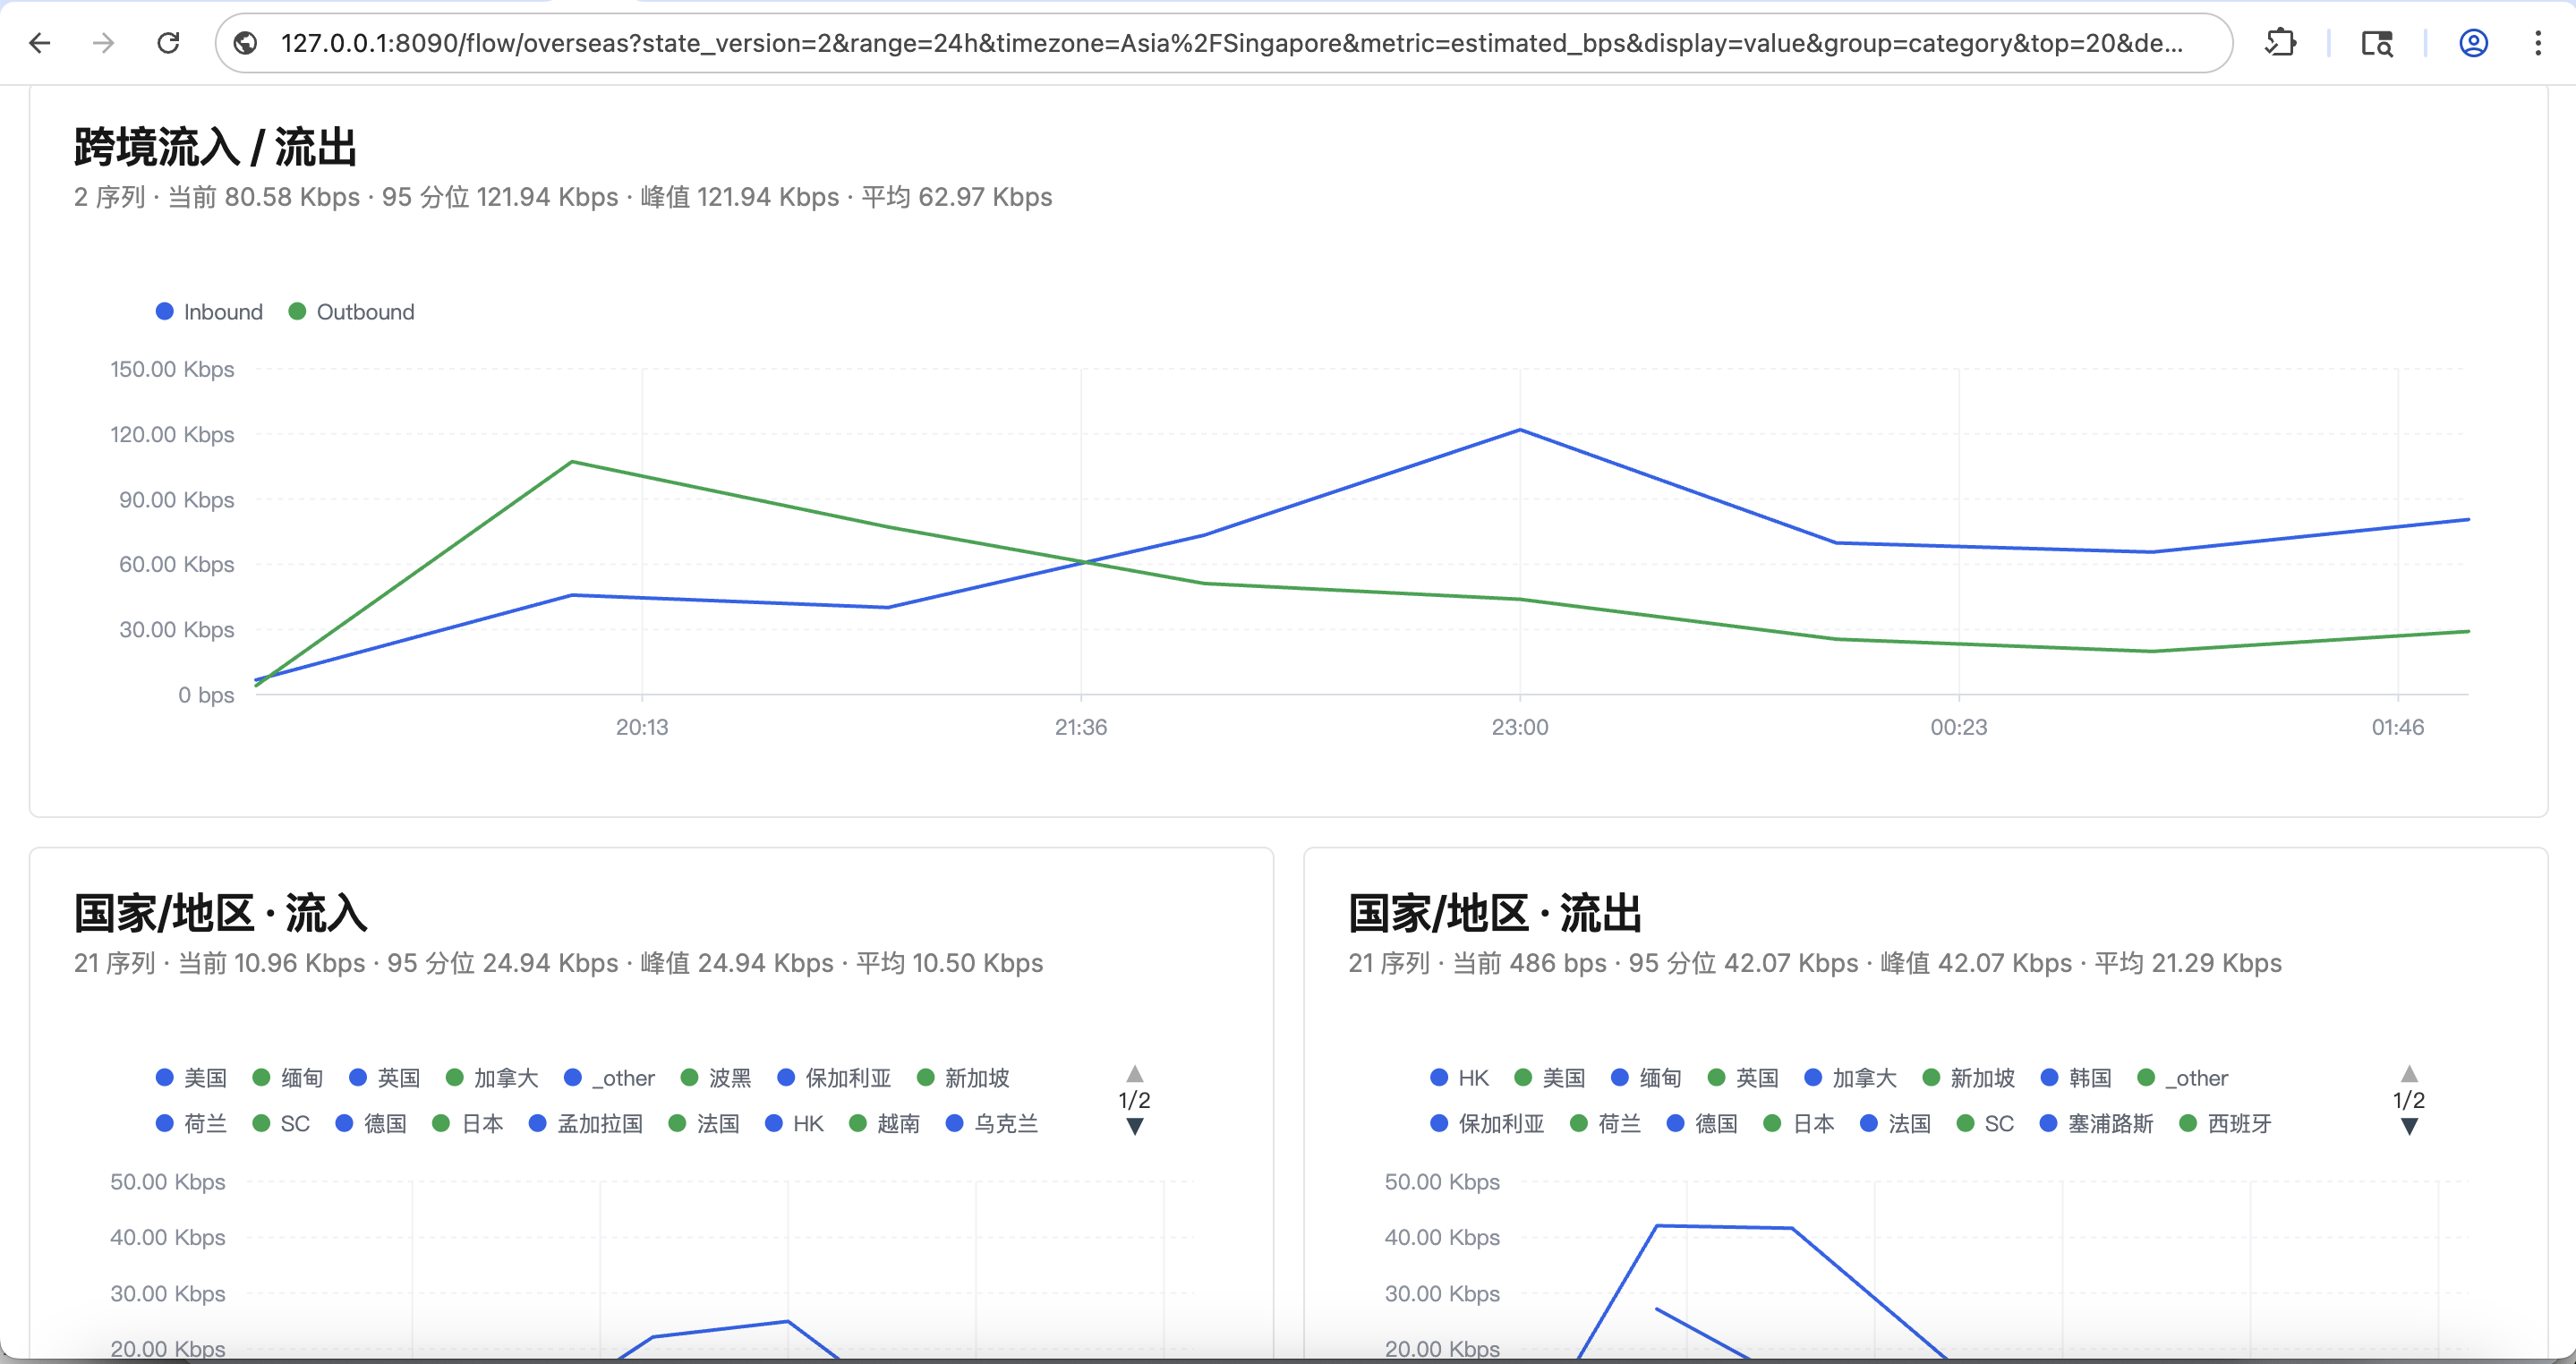
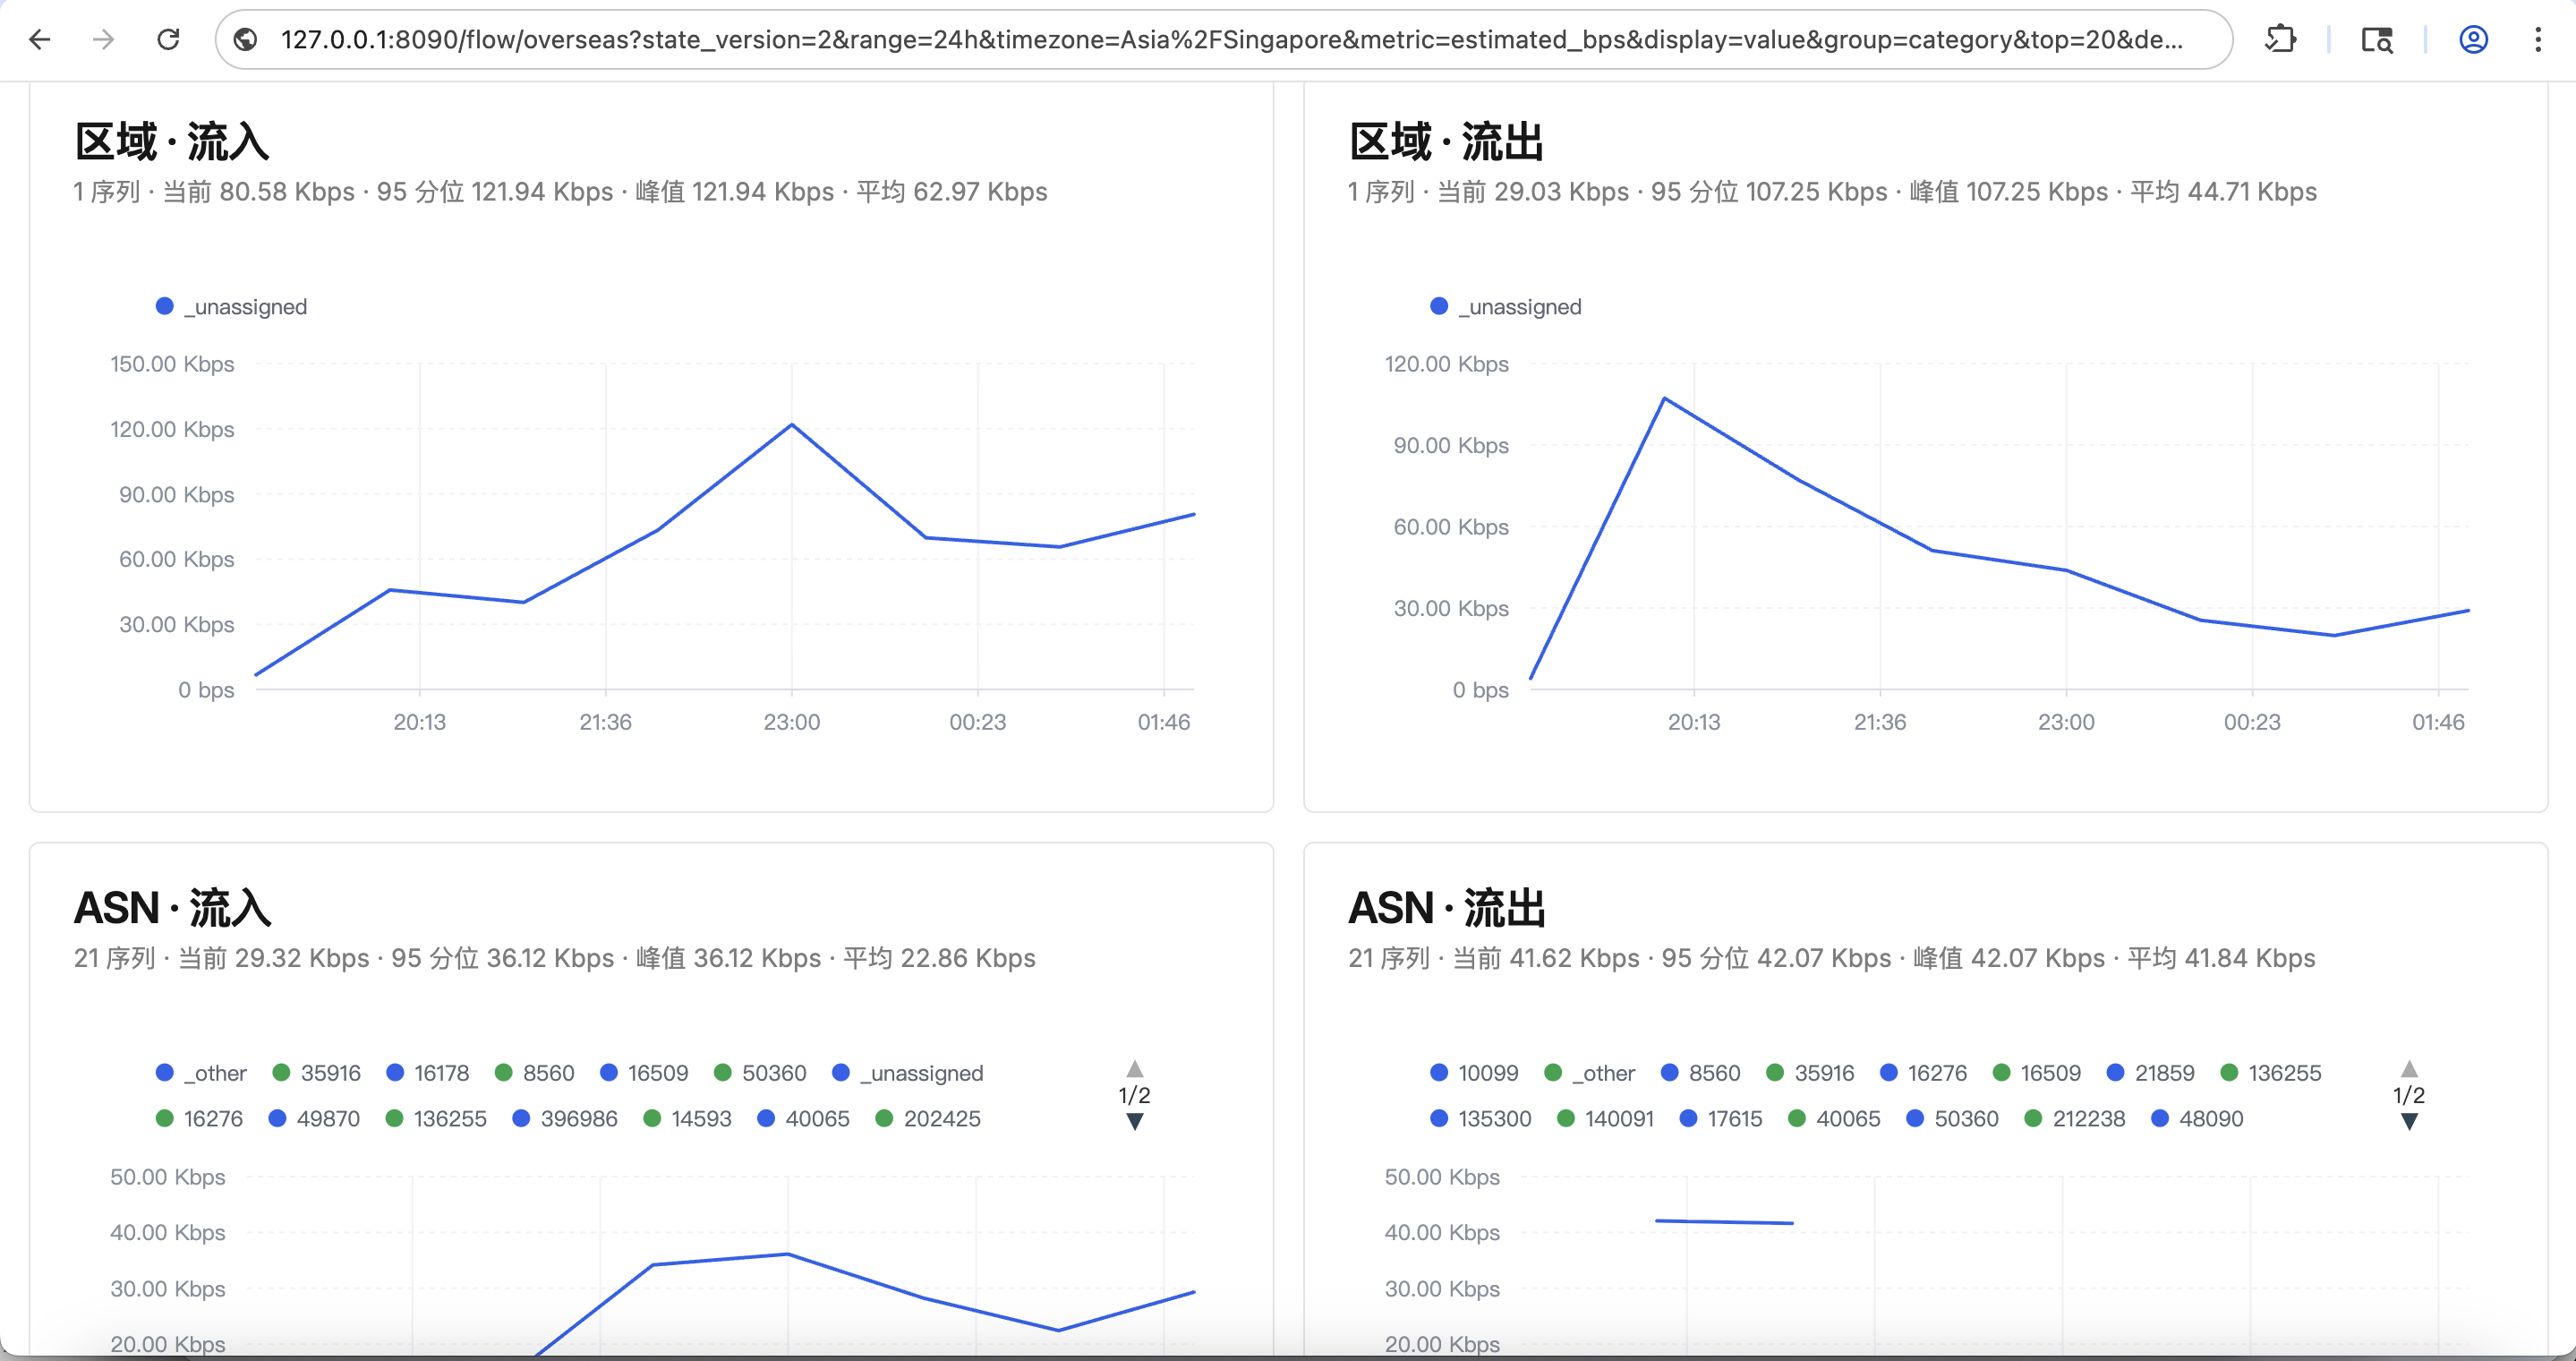
The cross-border report was built for the second chasm. It opens with three KPIs — observed cross-border IPs, local hosts with cross-border traffic, and VPN share — then unfolds by cross-border inbound/outbound, country and region, area, ASN, remote port and protocol. This is where an operator answers the most valuable question of all: which ASNs and regions carry traffic that could have been peered at an exchange, but is paying for transit instead.
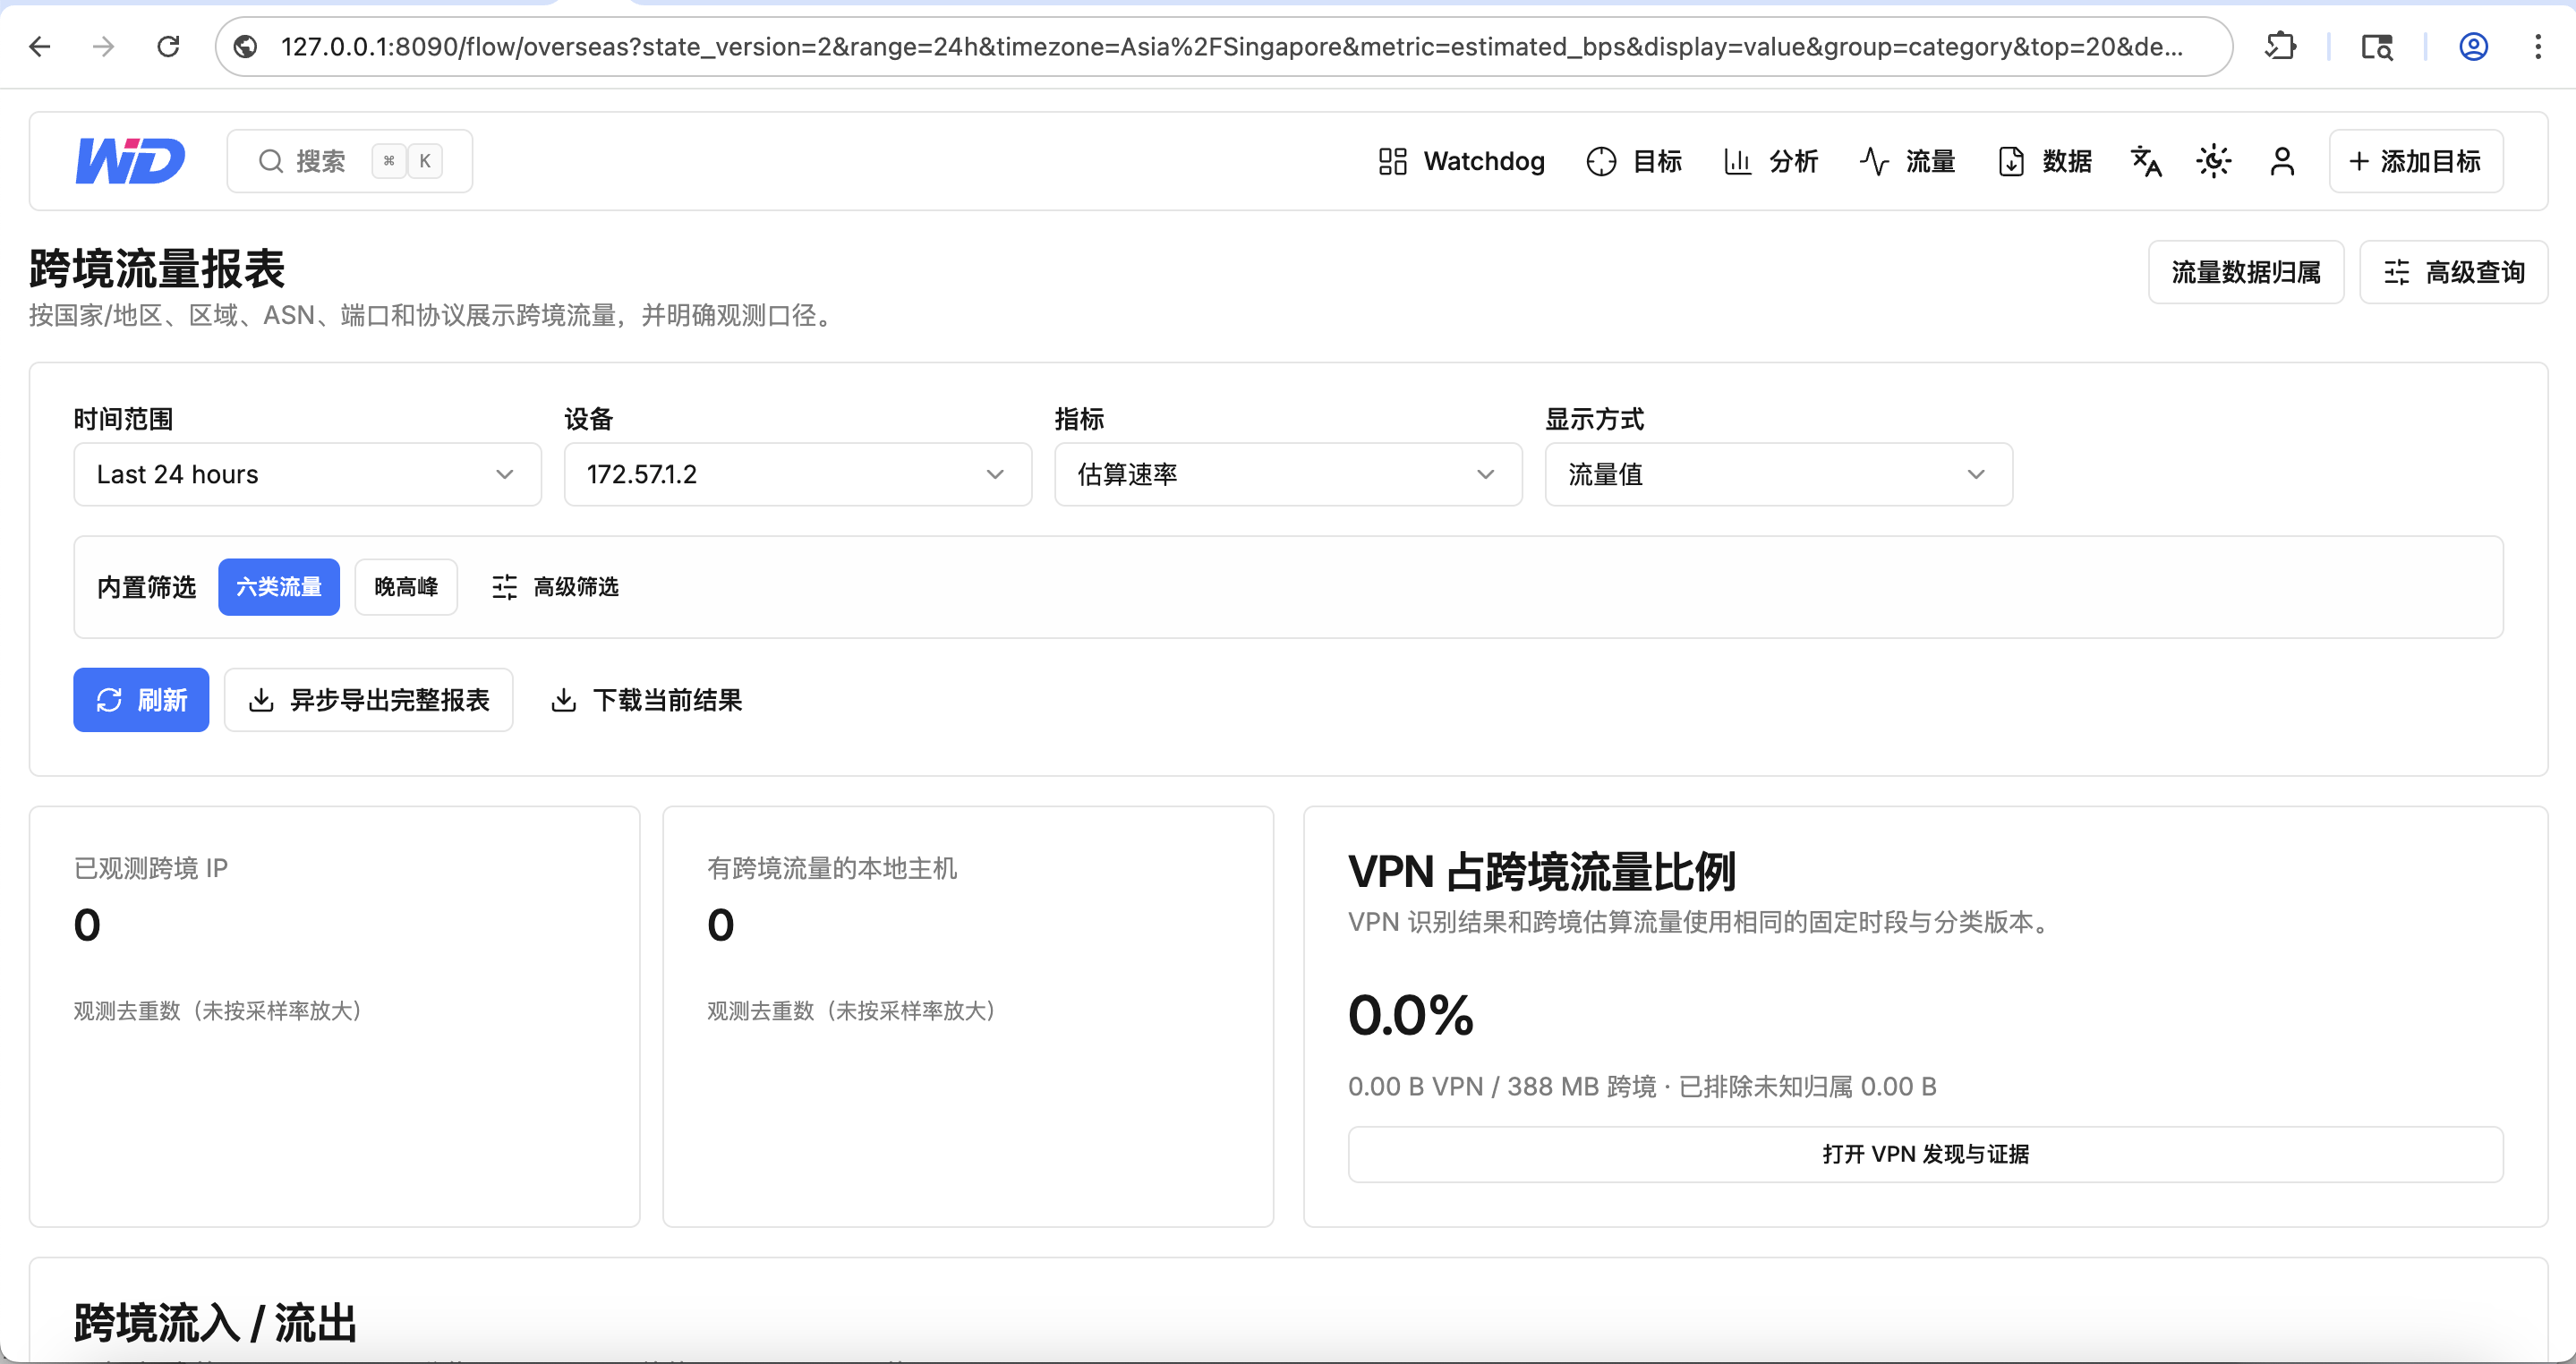
7. VPN Risk: Flow Direction Through a Compliance Lens
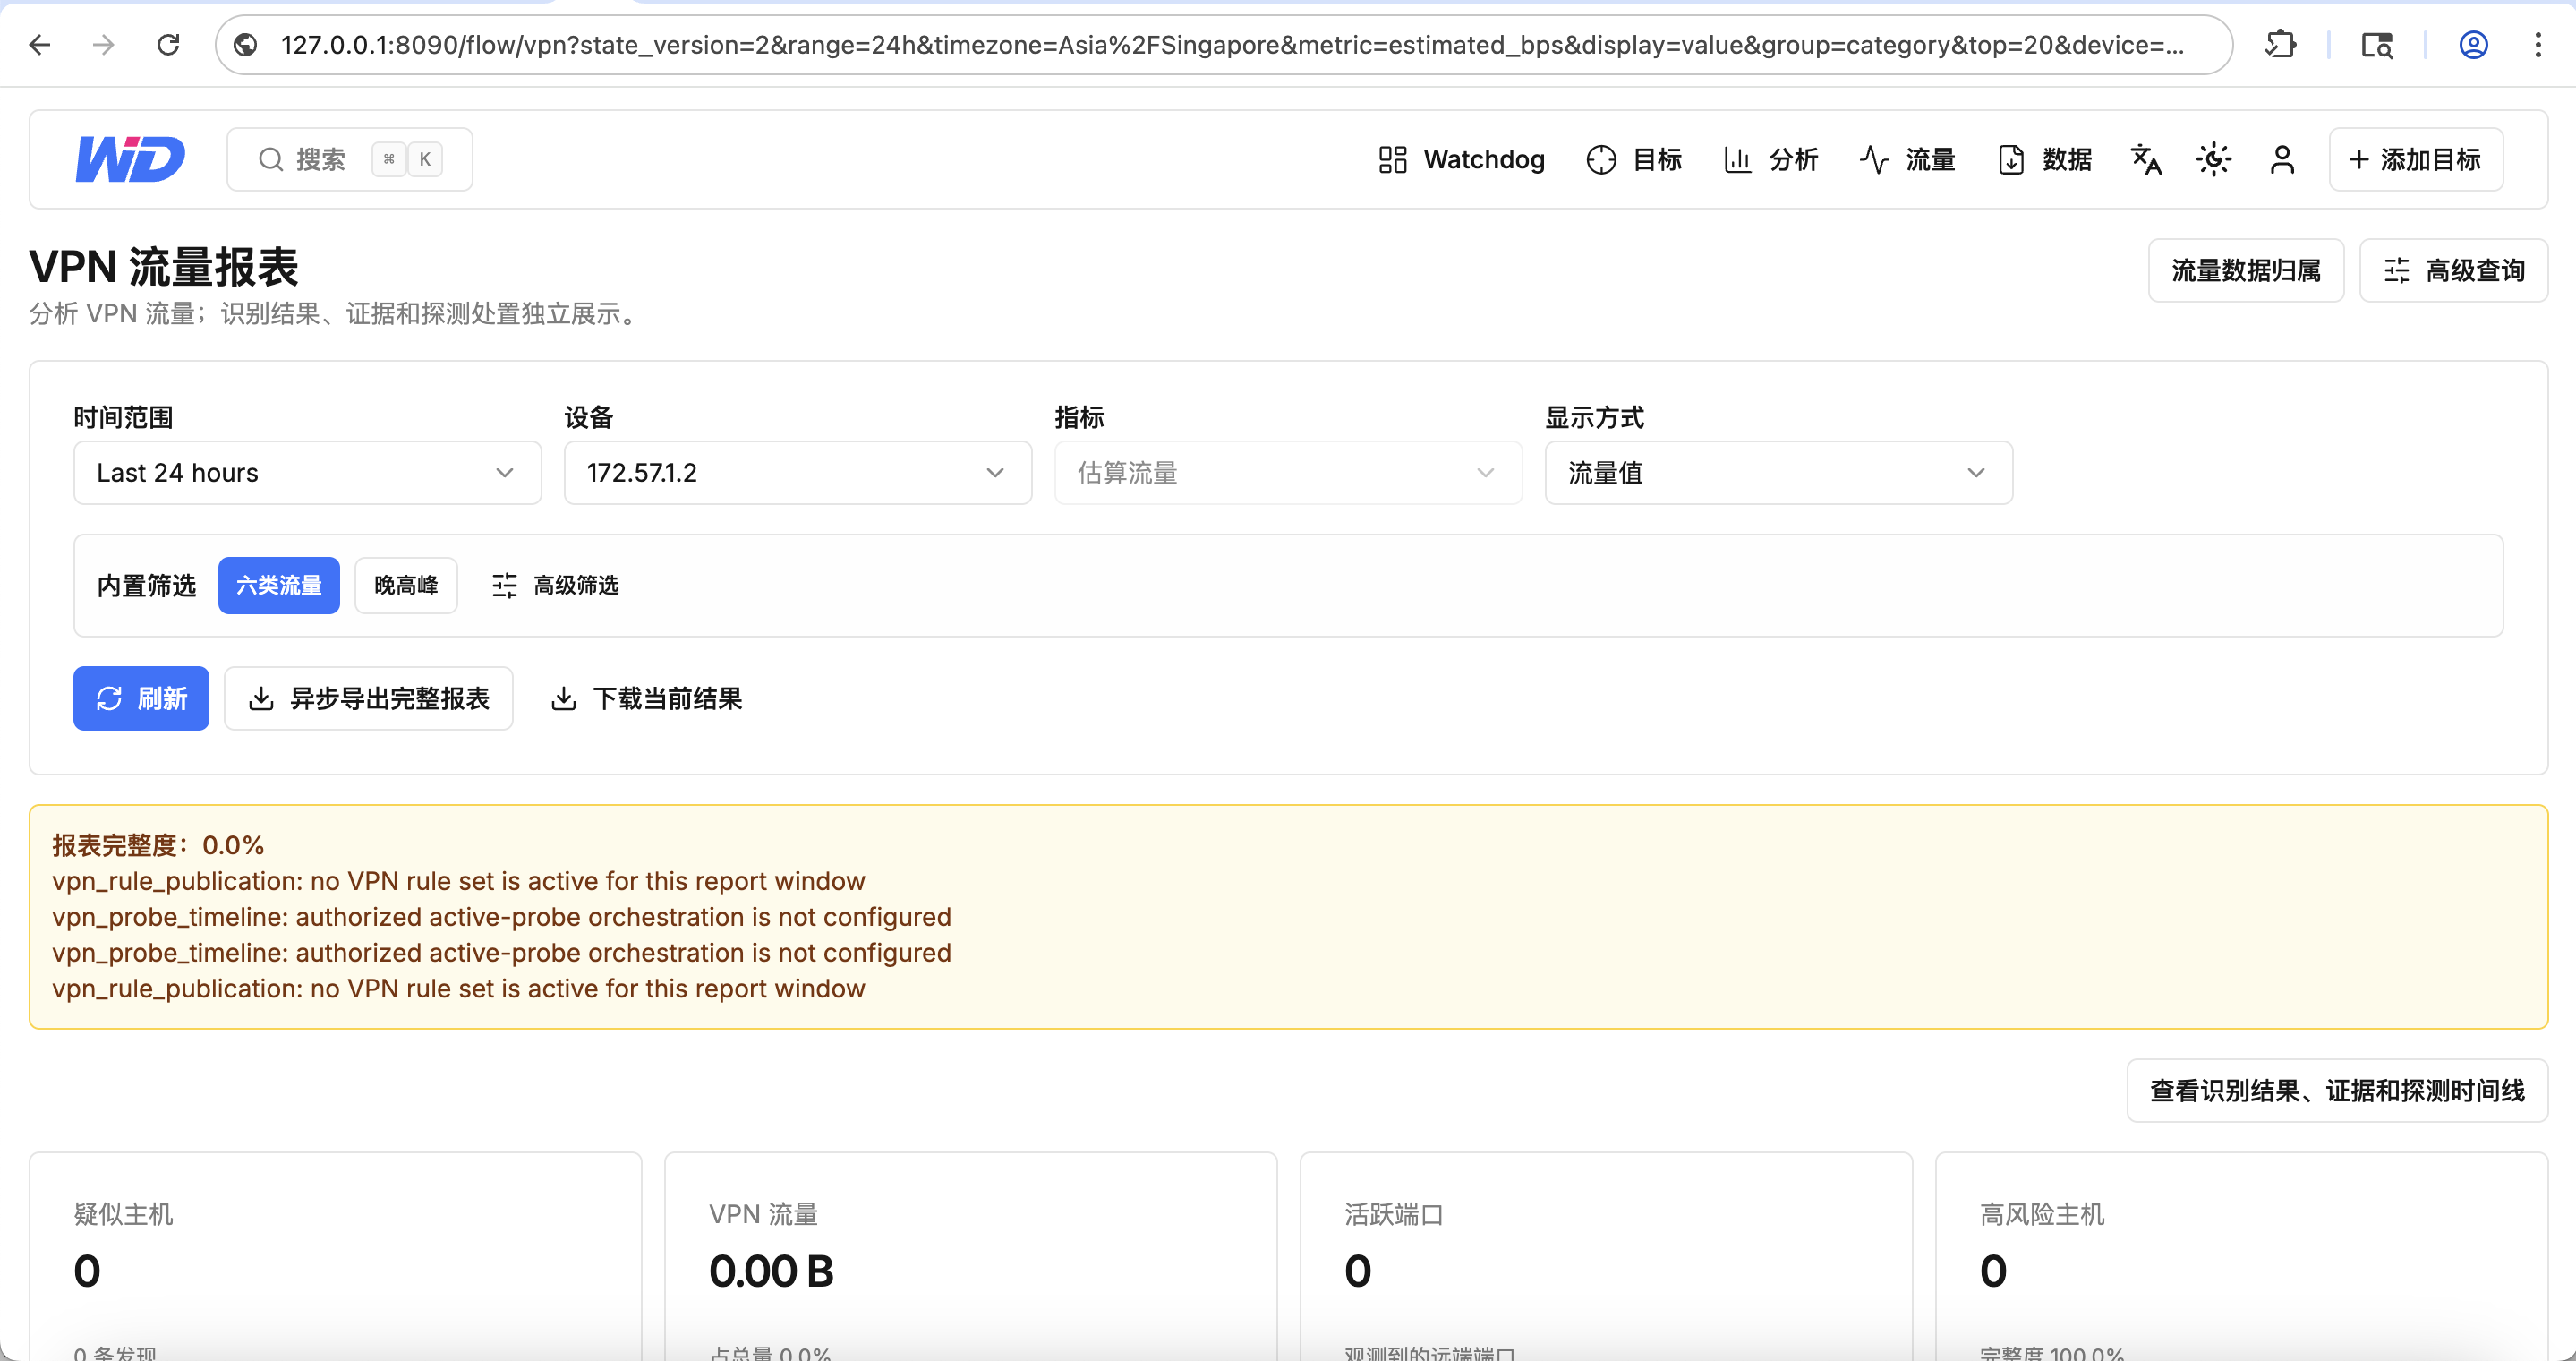
The VPN traffic report presents suspected hosts, VPN traffic, active ports and high-risk hosts independently; detection results, evidence and probe timelines are each inspectable, and the report’s completeness — together with the rule-publication state it depends on — is stated explicitly. For cross-border business, compliance and cost have always been two sides of one ledger.
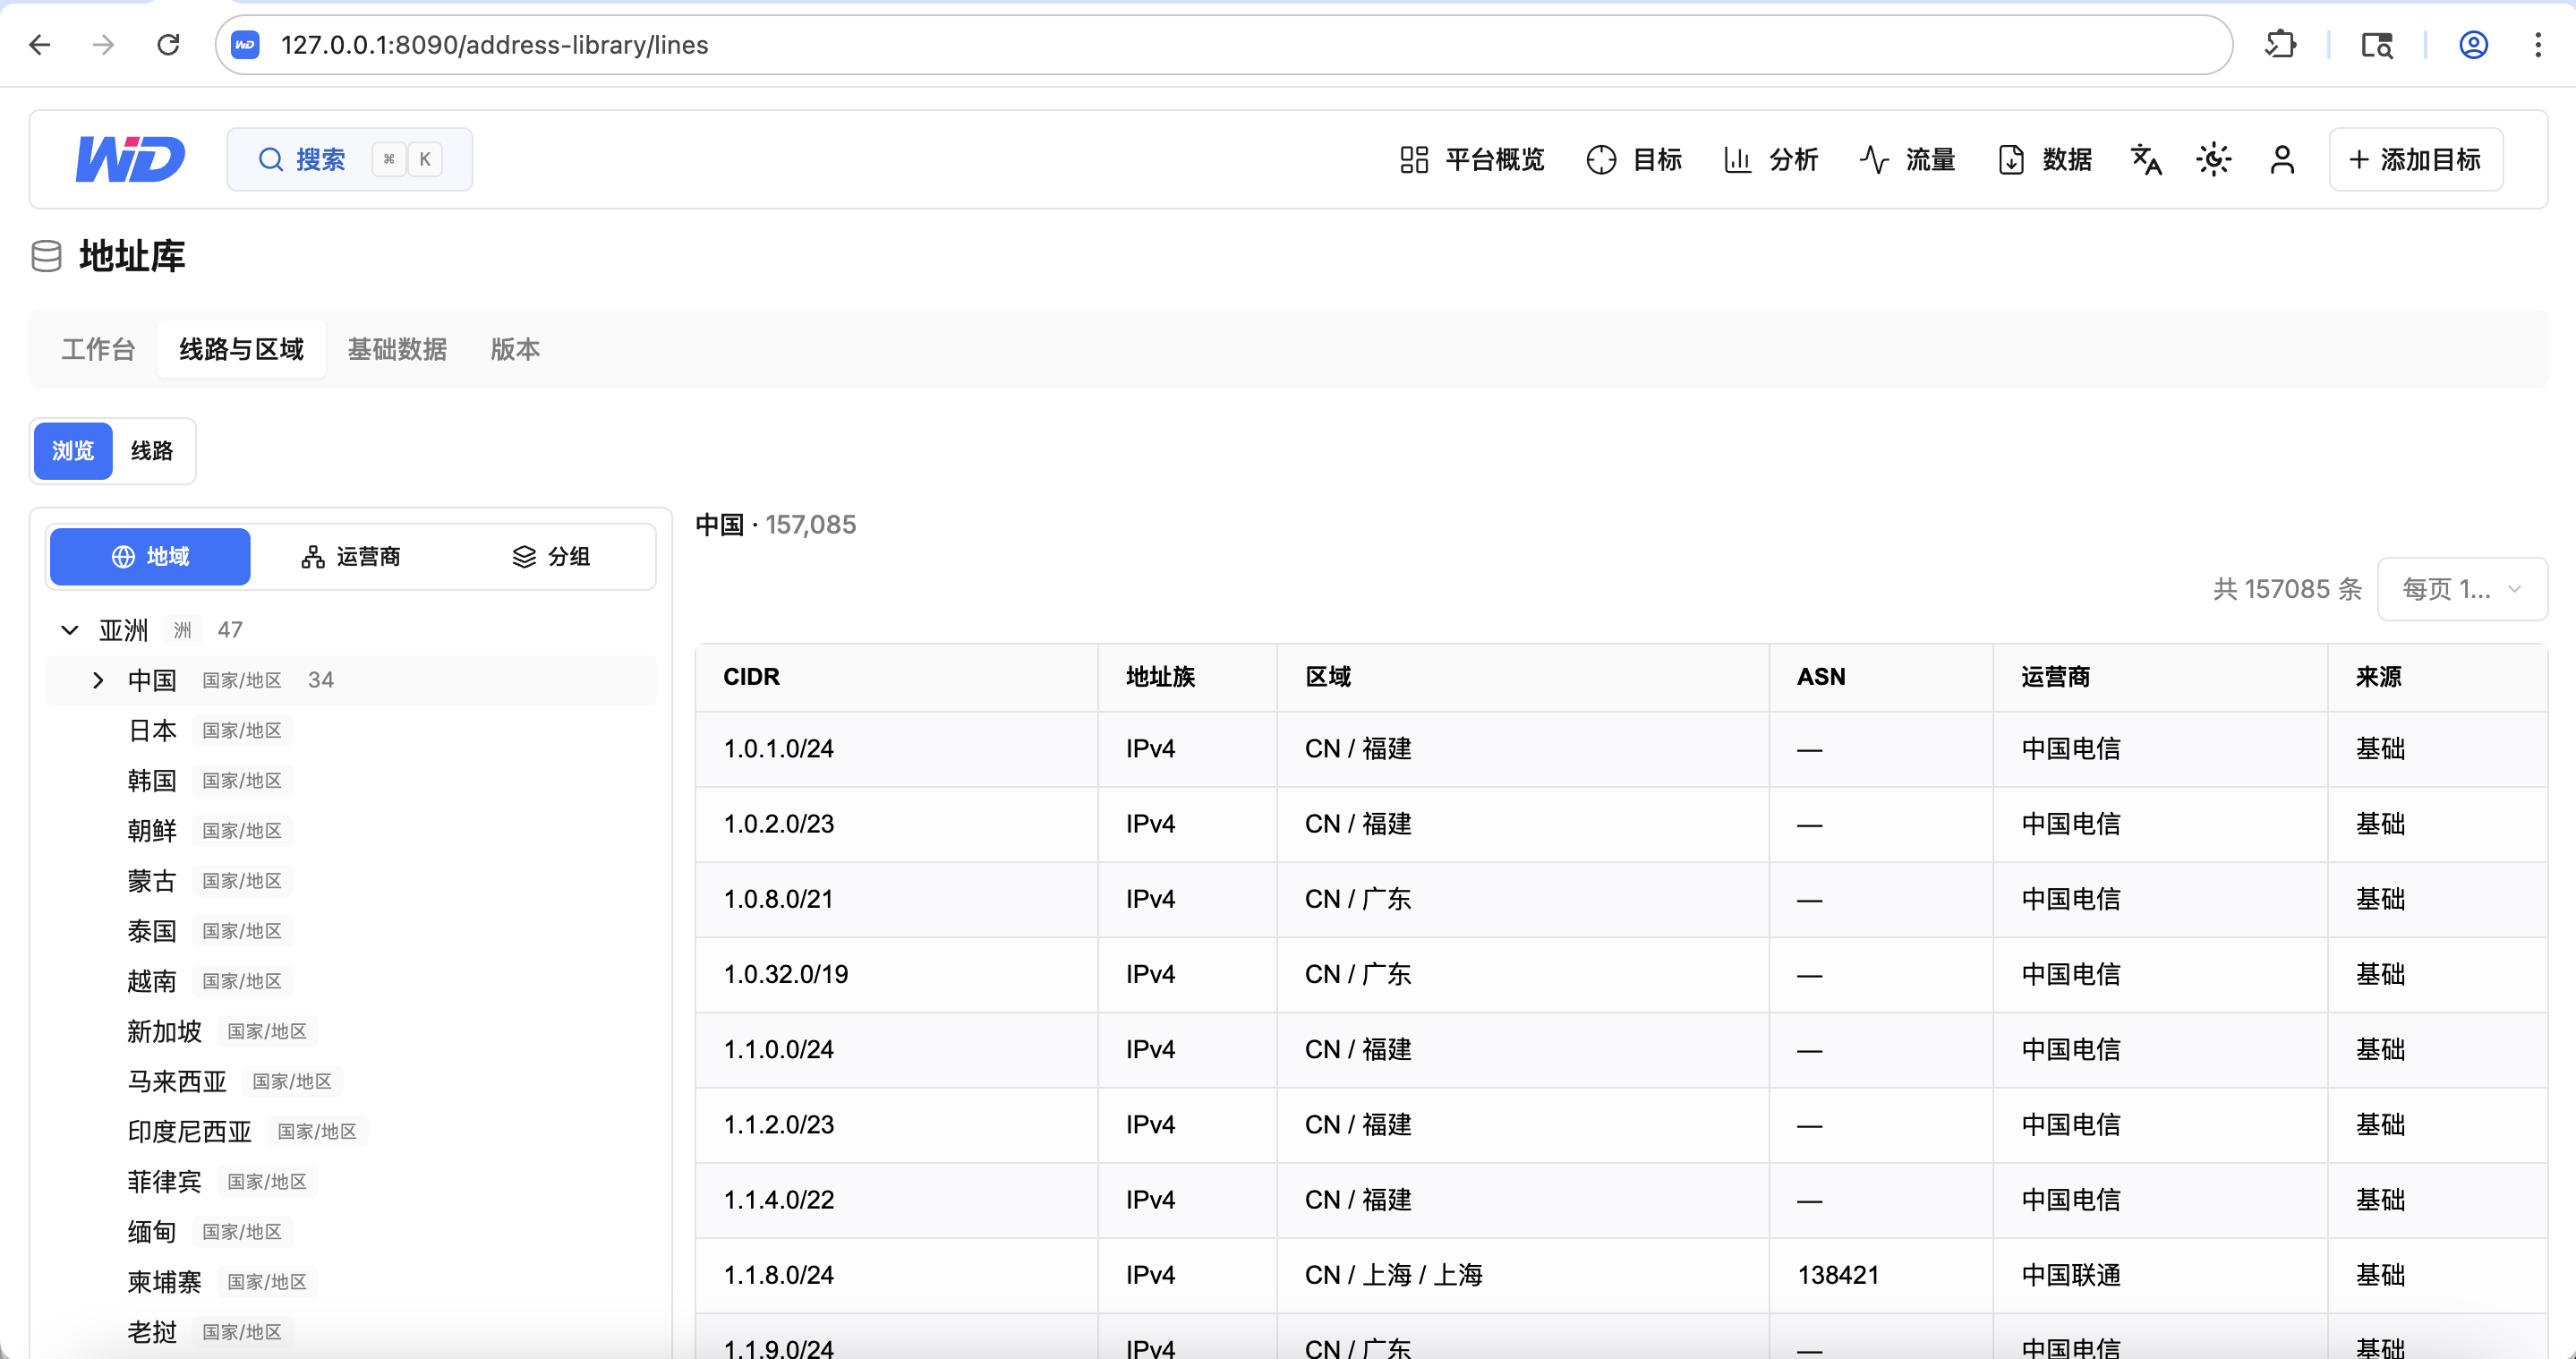
8. The Address Library: The Root of All Attribution
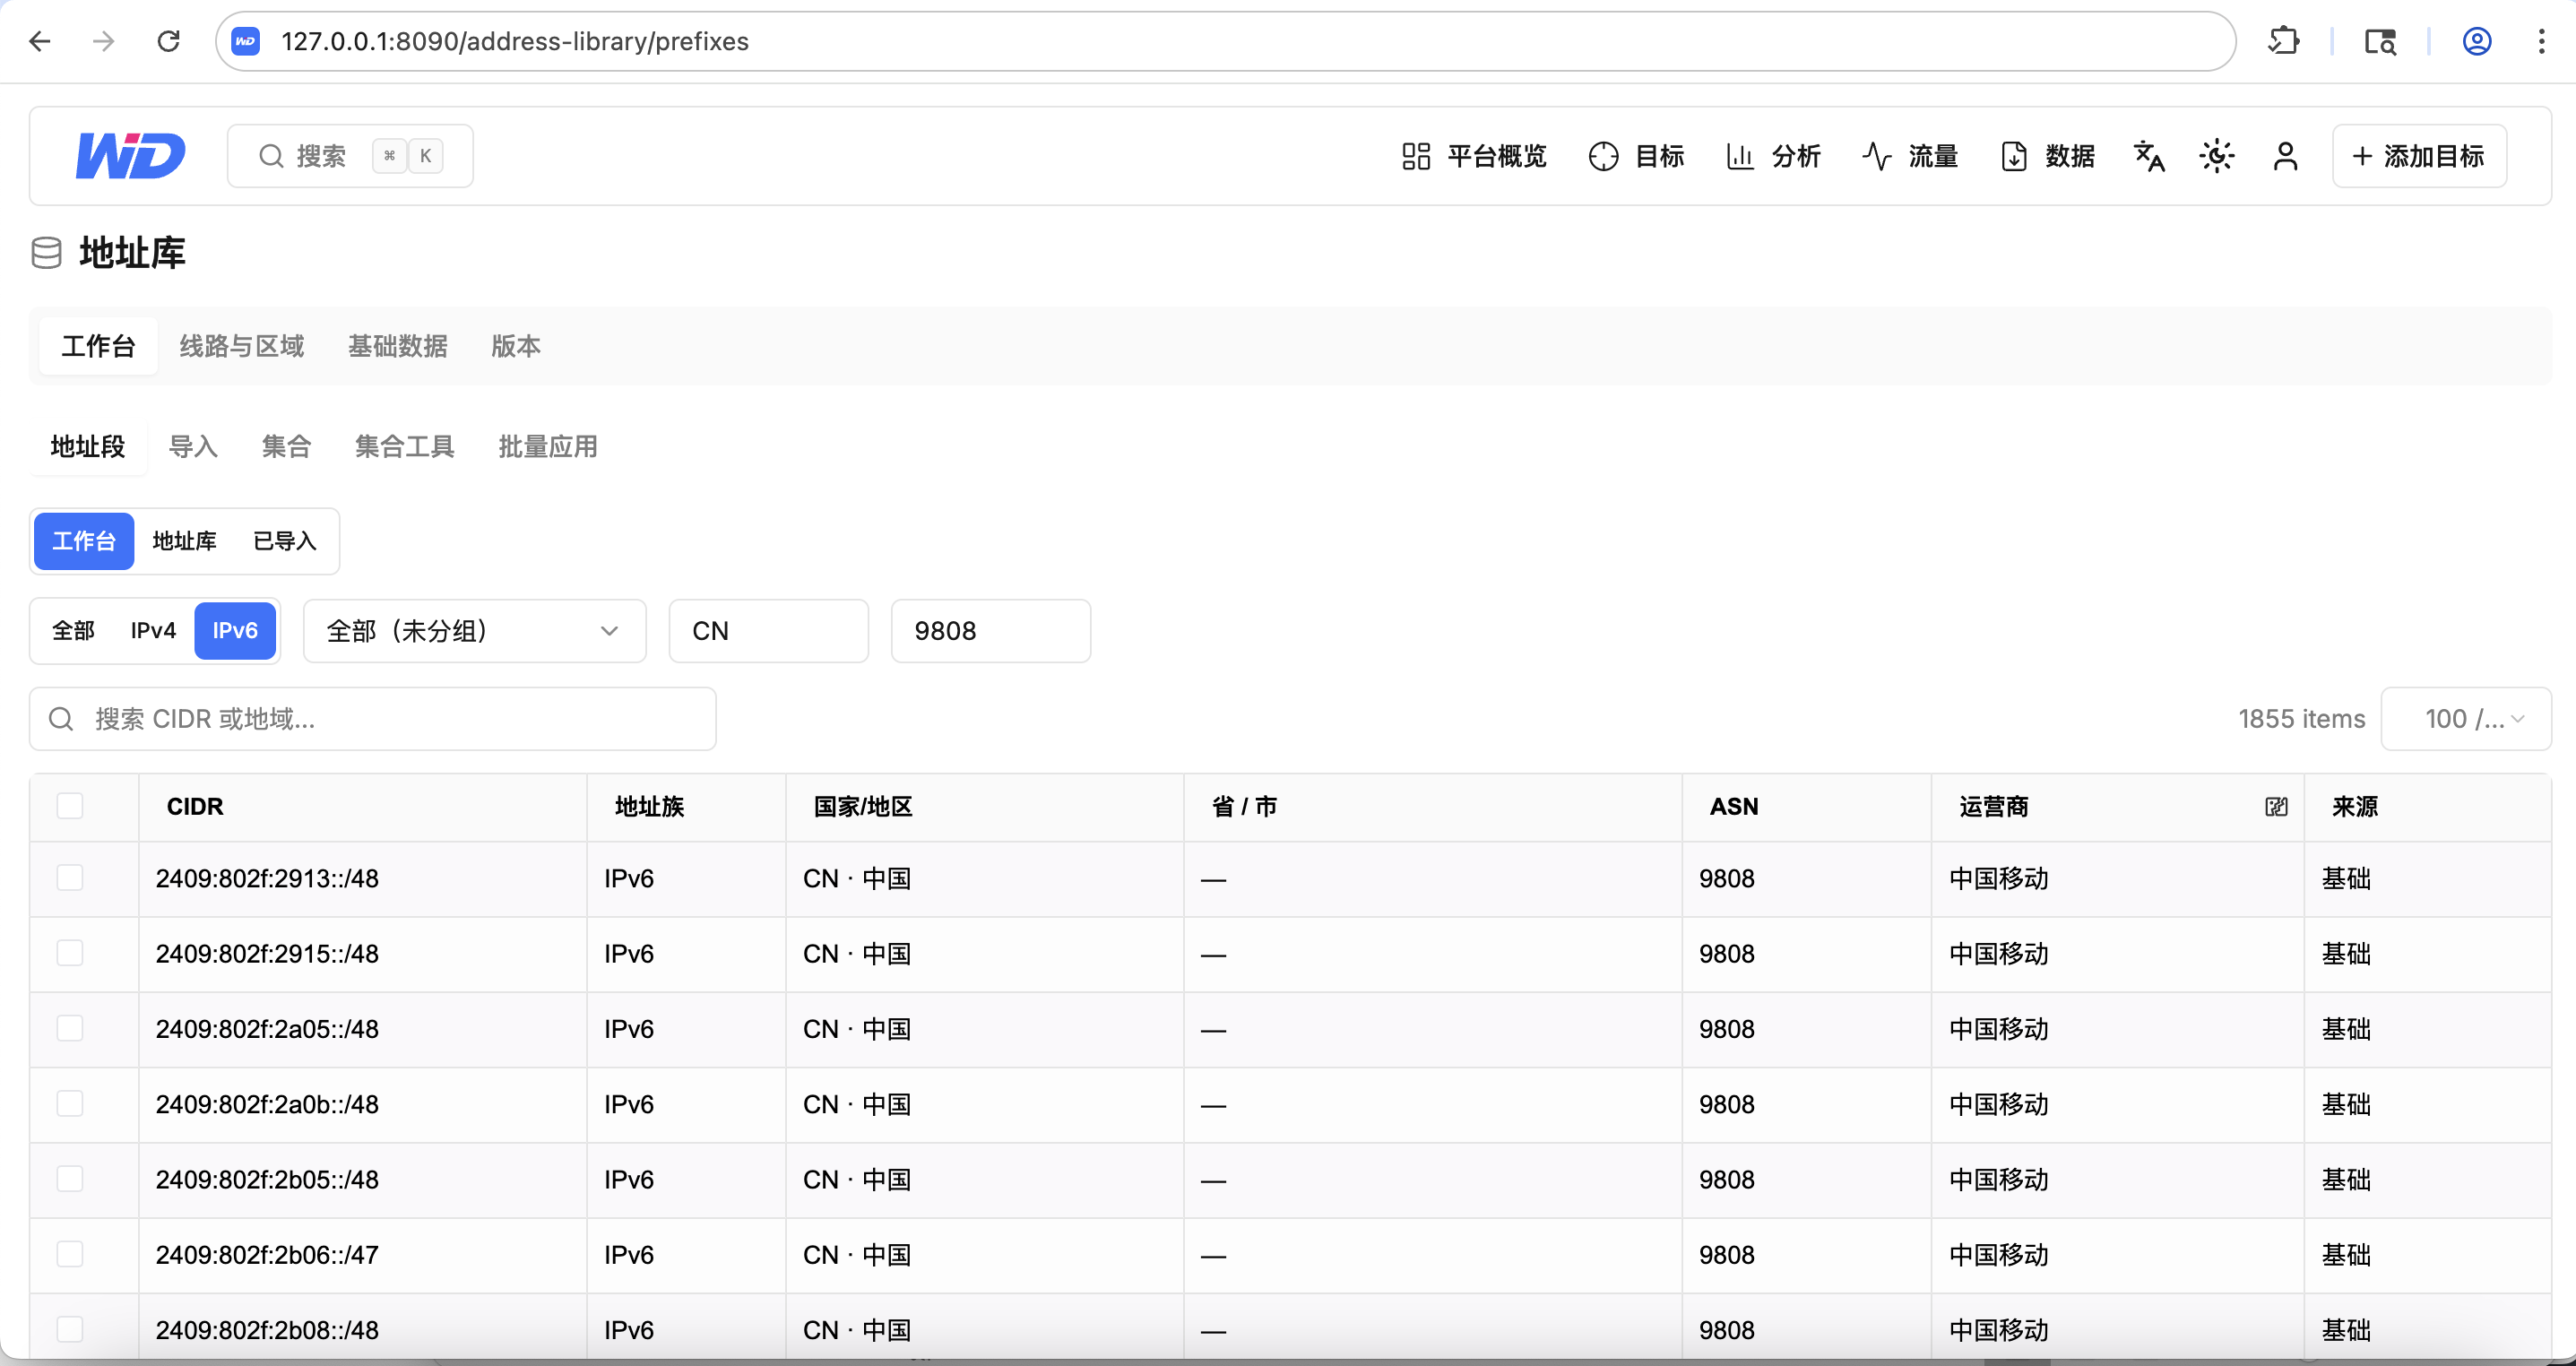
Whether the six-class placement can be trusted depends on whether the address library can be trusted. Watchdog’s address workbench manages more than 2.6 million IPv4/IPv6 prefixes, each annotated with country and region, province and city, ASN, carrier and source. The lines-and-regions view organizes them by continent, country, province, city and carrier into a tree with composable filters. Base-data dictionaries maintain geographies, carriers, search engines, cloud providers and natural regions. The versions page turns “generate snapshot → approve and activate → publish classification version → start the processing service” into a guided pipeline, and every release carries a checksum and a signature. Attribution can be corrected — but every correction has a version, an approval and a trail.
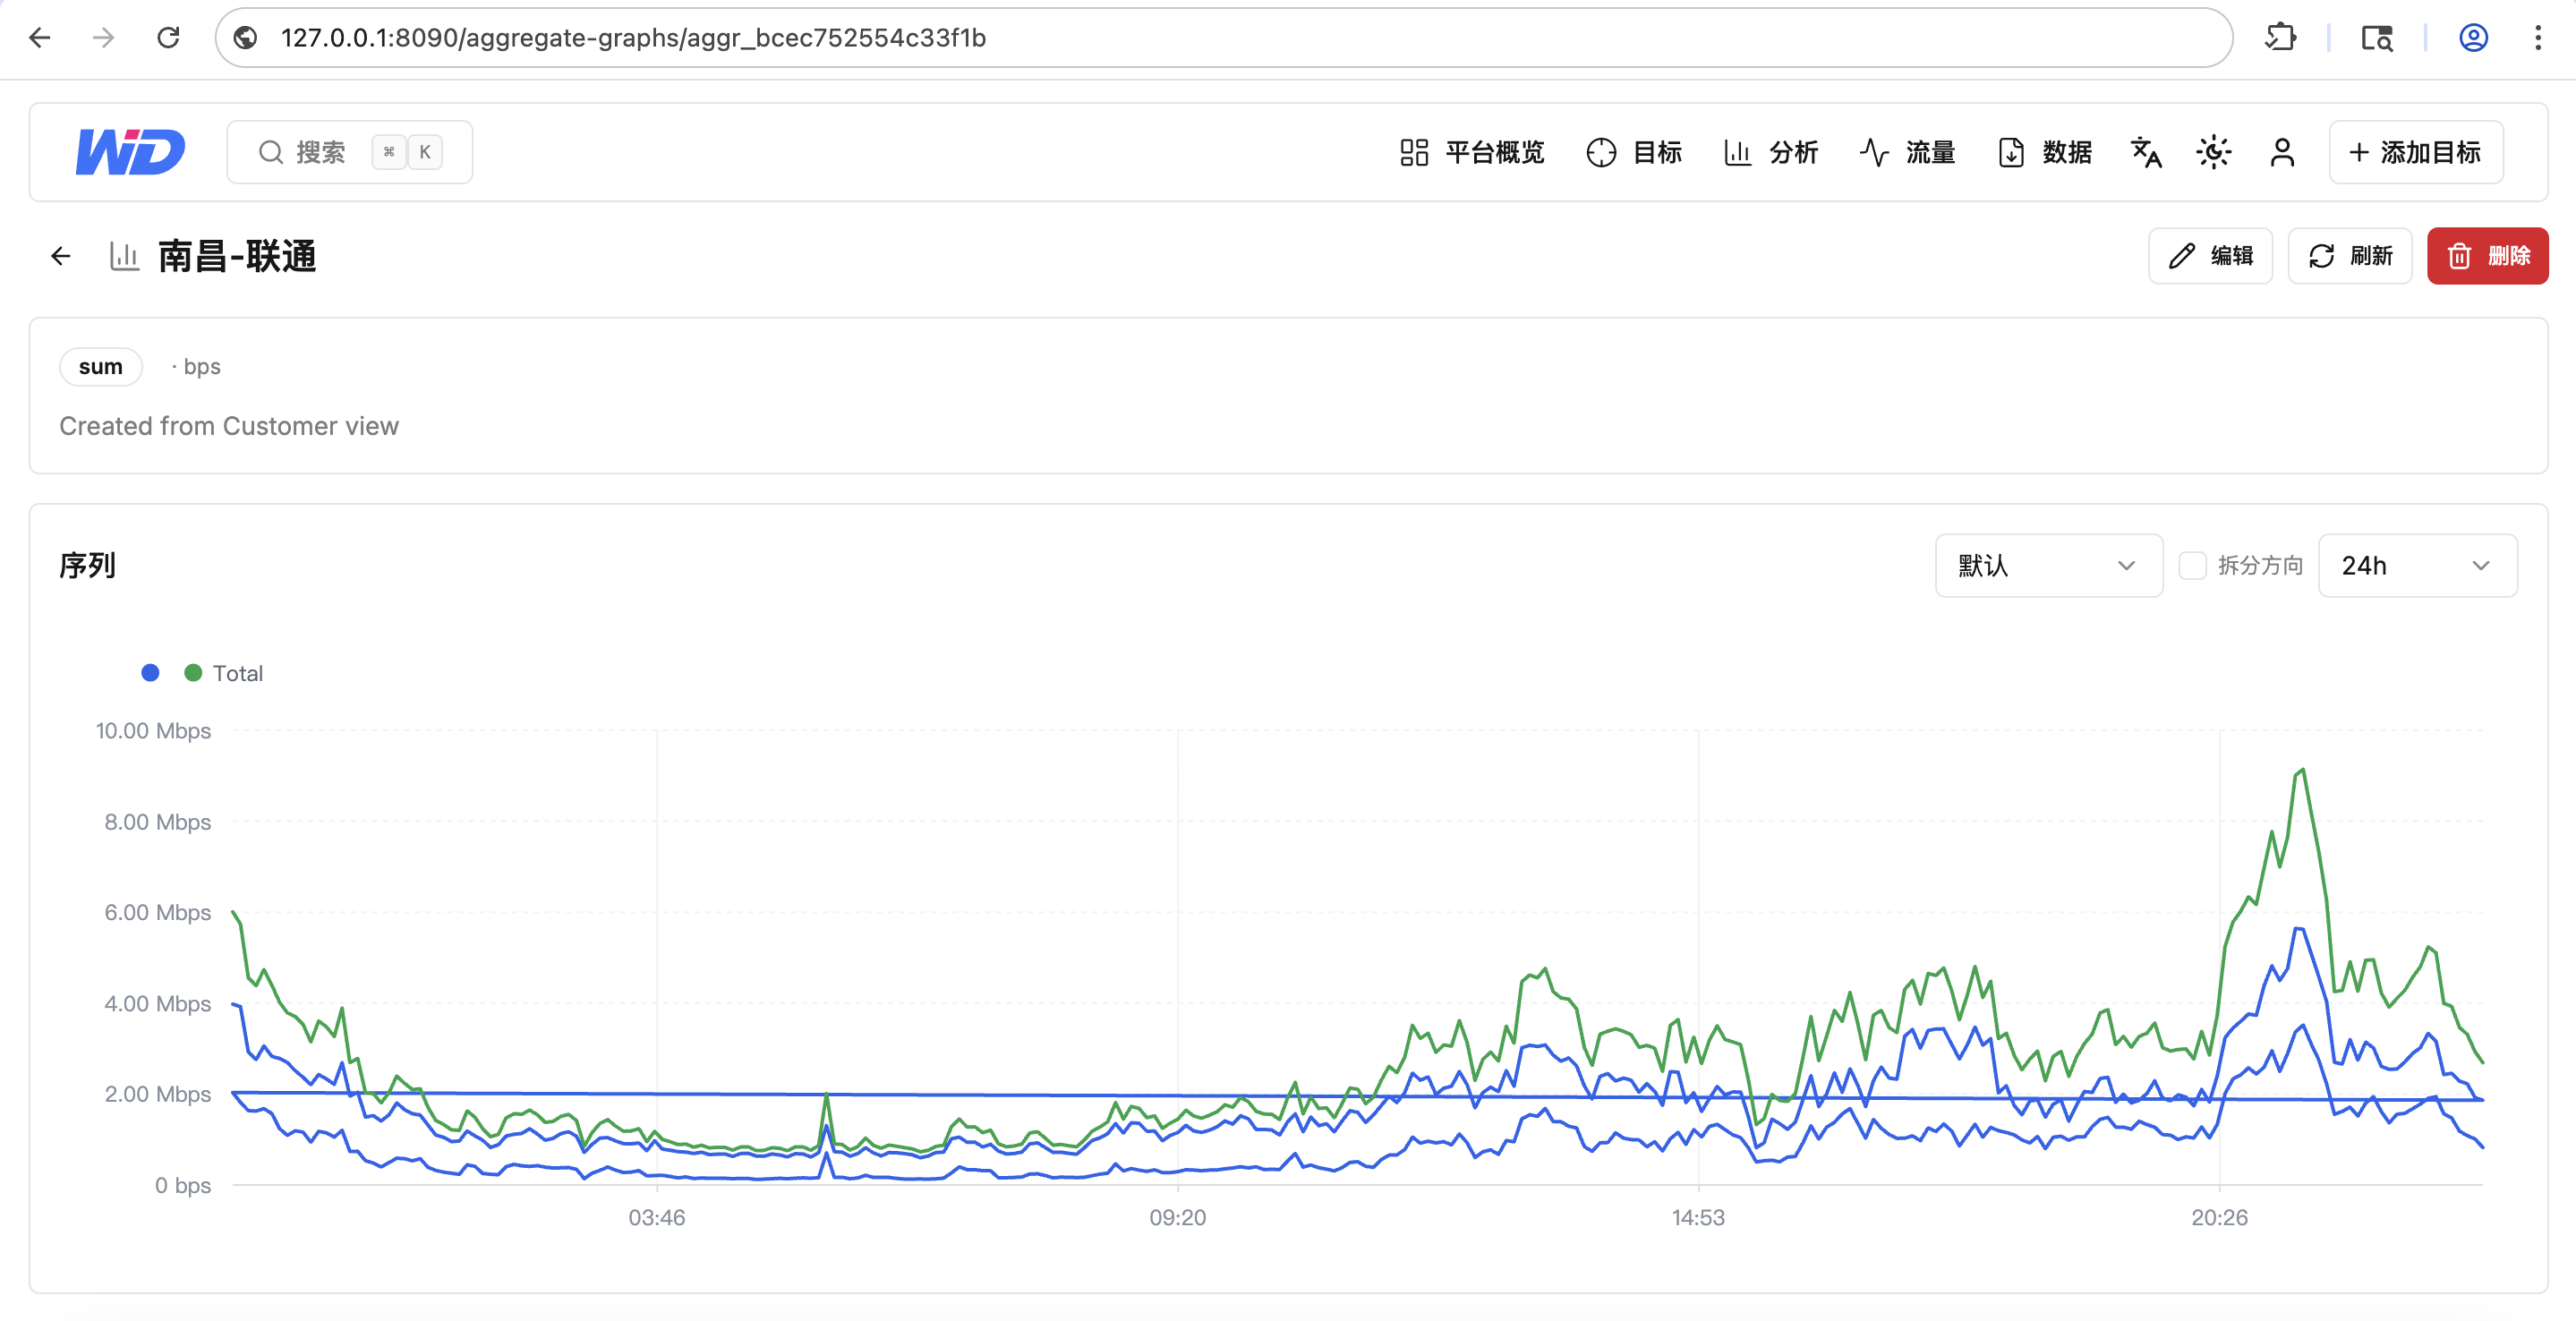
9. Aggregate Charts and Dashboards: A Whole Line in One Picture
Metrics across devices and ports can be aggregated into one chart by sum or percentile, valued by customer / supplier / raw view, saved as an image, exported to CSV, or assembled into dashboards for daily inspection.
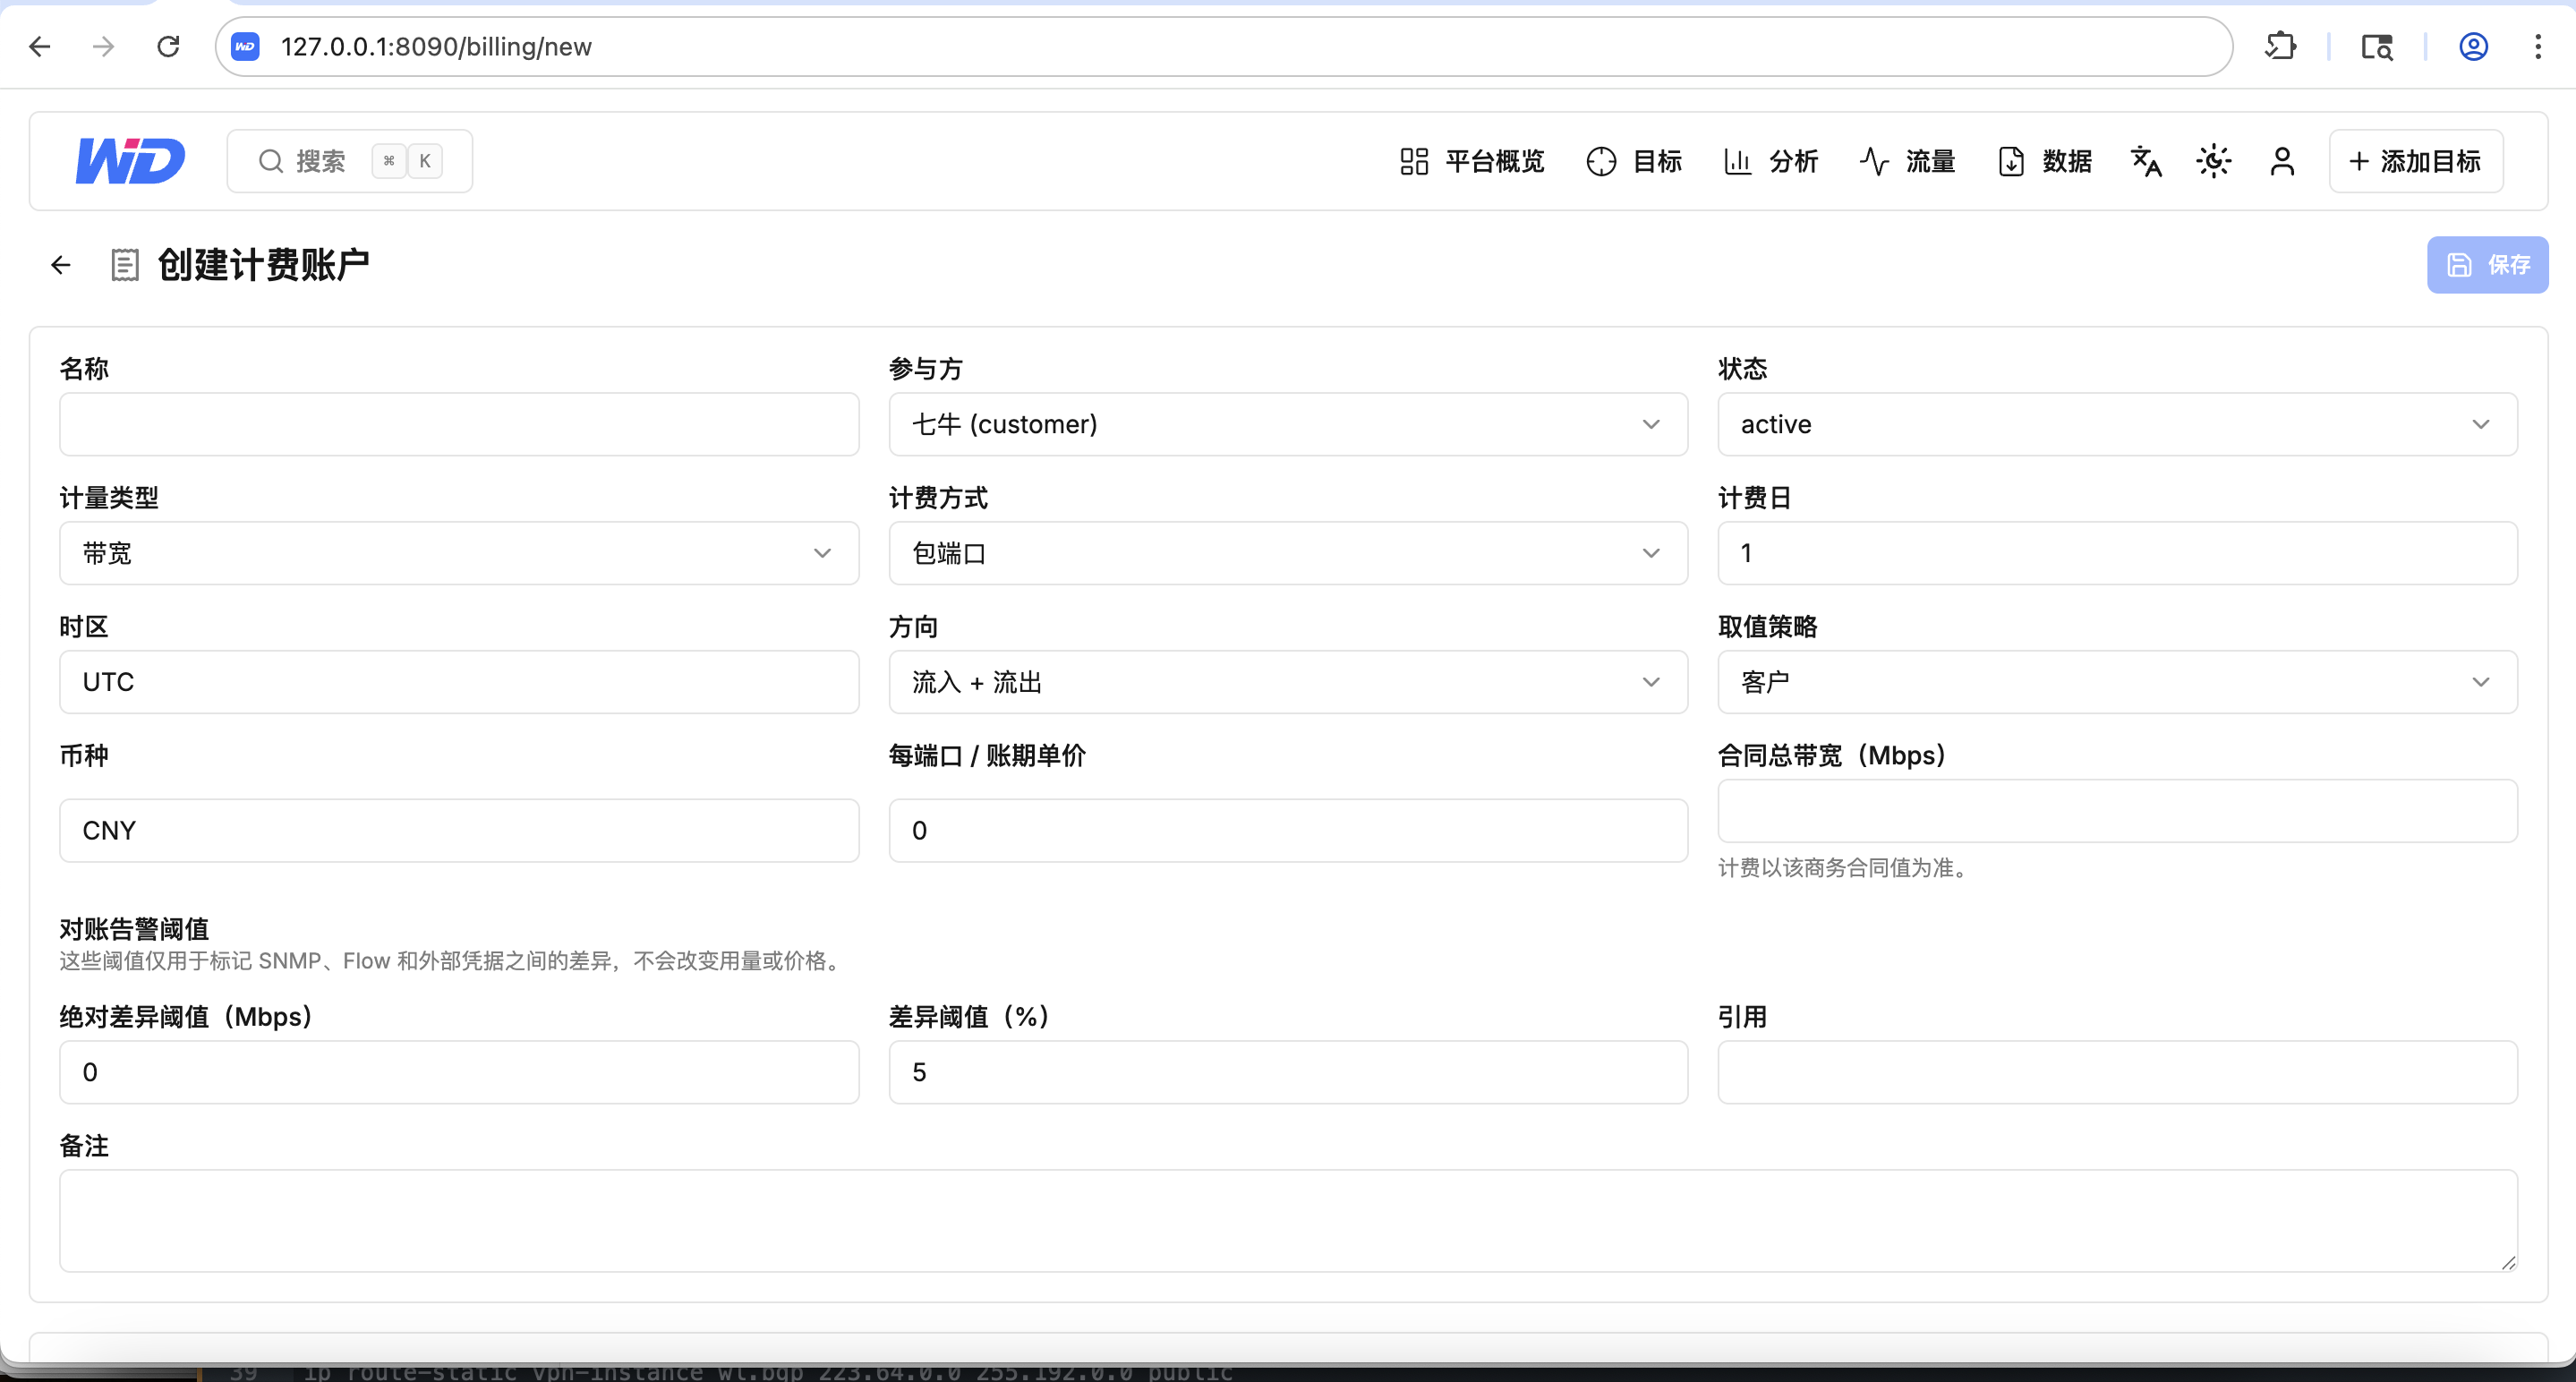
10. Traffic Billing: Evidence Before the Bill
Watchdog’s billing module is built around evidence. A billing account can meter bandwidth or traffic; bill by port package, monthly 95th, daily 95th or monthly average; specify inbound, outbound or inbound-plus-outbound; choose a raw, supplier or customer valuation strategy; and bind a set of ports across devices. Contract bandwidth and reconciliation alert thresholds are frozen into a snapshot when a period is created; discrepancies among SNMP, flow and external evidence are flagged as reconciliation issues; and every calculation, approval and closure of a period records its version and operator. Every adjustment is appended to the ledger with a reversing entry, and the whole can be exported as CSV and Parquet for finance systems to verify.
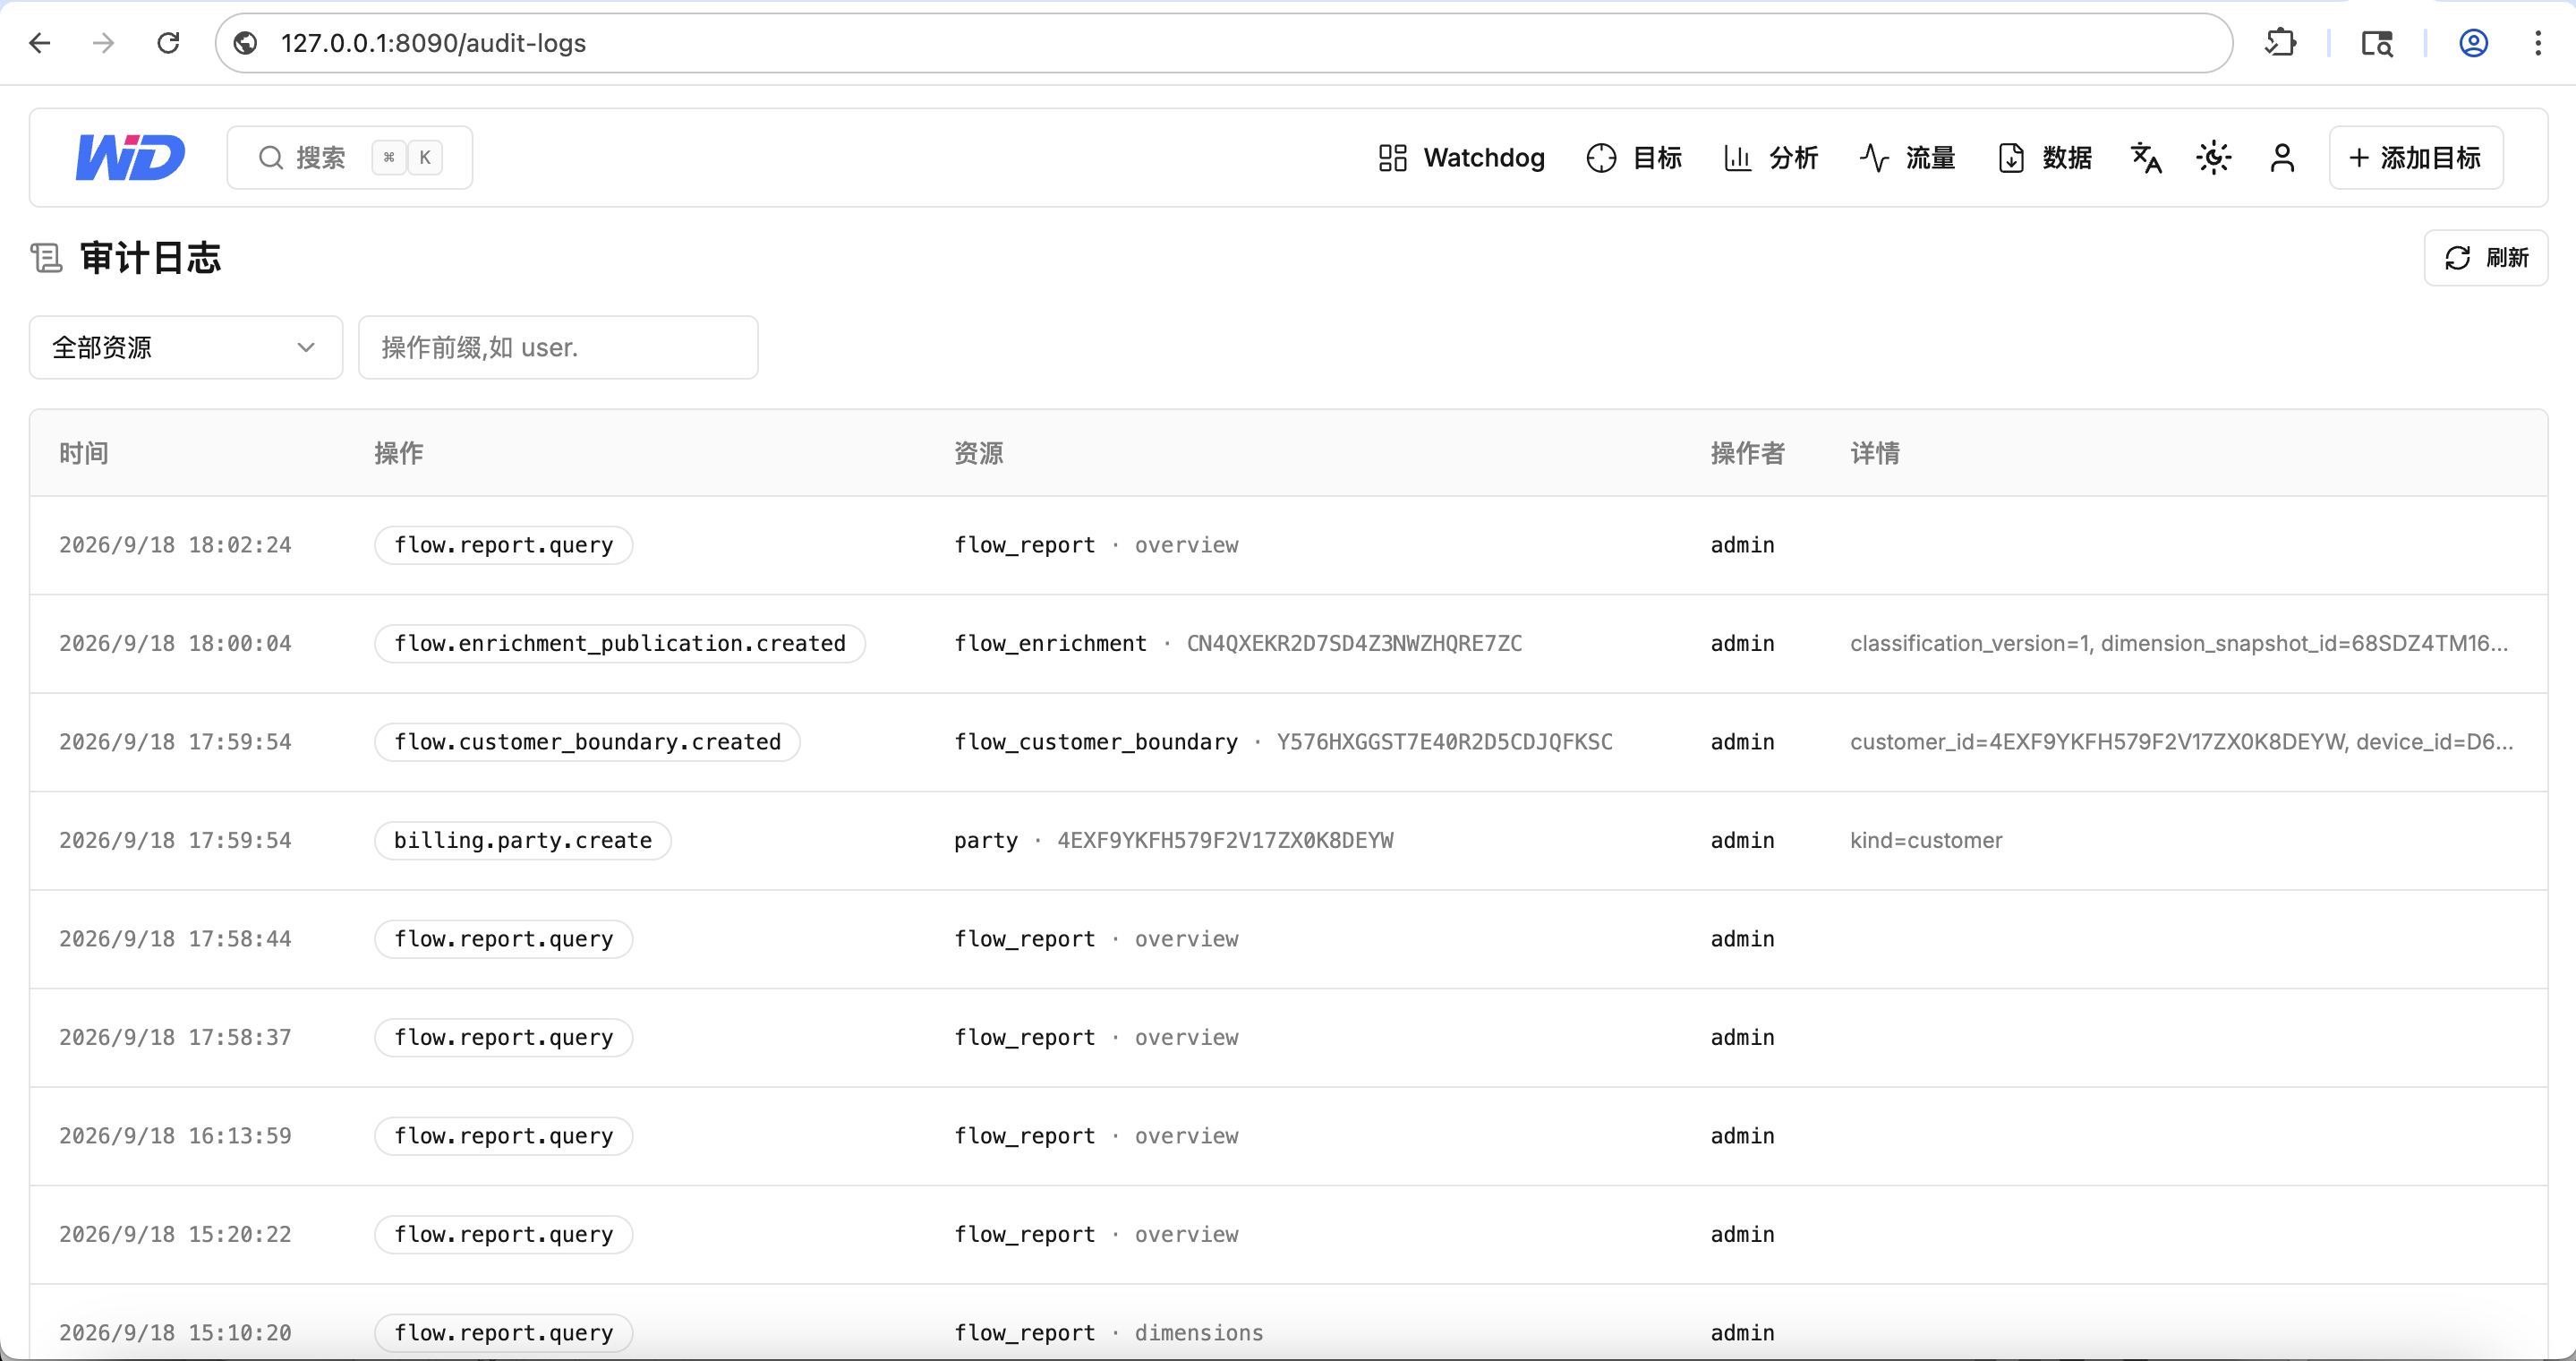
11. Governance: Who Saw What, Who Changed What
Five built-in roles, forty-nine abilities, and resource permissions granted item by item for devices, device groups, ports, billing accounts, charts and metrics give analysts, billing staff, operators and viewers exactly what they need. The audit log records every action, resource and actor; background jobs, retention policies and export tasks hand long-running computation and the data lifecycle to trackable jobs.
V. From Data to Value: An Actionable Framework
Seeing does not automatically equal value. We suggest operators connect Watchdog’s reports to business decisions in three ascending layers:
| Layer | Key metrics | Decision | Value realized |
|---|---|---|---|
| See | Share of six flow classes, cross-border share, top ASNs / countries / IPs | Establish a flow baseline; spot anomalies | Replace experience with fact; stop the waste you couldn’t see |
| Explain | Attribution by customer / line / province / carrier; 95th percentile vs. contract bandwidth | Locate the source of settlement disputes; identify subsidies and overuse | Give every cost an owner and every negotiation its evidence |
| Act | Traffic of peering-candidate ASNs, migratable share of cross-province traffic, port utilization and capacity gaps | Adjust peering strategy and routing; renegotiate settlement and pricing; plan capacity | Turn transit into peering, cross-province into local, bandwidth into profit |
Each step of these three layers maps to a set of pages in Watchdog — from the traffic overview to multi-dimensional analysis, from the cross-border report to billing periods. Data no longer stops at “seen”; it moves on to “computed” and “changed.”
VI. Born for Token Operators
WLStack Network itself operates a global BGP backbone and cross-border dedicated lines, as well as a dual-domain MaaS platform serving both the domestic and international markets. Watchdog is first of all the tool we built to solve our own problem: when inference requests are scheduled between routed.cn and routed.hk, when model capabilities are exported across borders, when every customer’s traffic must be attributed precisely, we need a pair of eyes that can see where the flows go.
On the sFlow feed of a single core switch, Watchdog ingests and classifies more than two hundred million flow records a day, aggregating them into minute, hour and day tiers so that a 24-hour report returns in seconds; address-library snapshots are published to processing nodes with versions and signatures, guaranteeing that the attribution of any flow is reproducible at any moment. These capabilities are now open to every operator facing the same problems: provincial and municipal carriers, exchange operators, ISP agents and IDCs, and every token operator that writes bandwidth into its gross-margin sheet.
VII. Four Values, Converged
| Dimension | Value |
|---|---|
| Flows made visible | Six flow classes, cross-border detail, source and destination IPs, all queryable record by record — “where did the traffic go” becomes a fact you can look up |
| Cost made attributable | Rooted in a versioned address library, every bit is attributed to a customer, a line, a province or a carrier, giving settlement and pricing a basis in evidence |
| Bandwidth made more valuable | Identify peerable transit, localizable cross-province traffic and the true 95th percentile — sell the same bandwidth at a higher value |
| Operations made auditable | Billing built on evidence, permissions granted by resource, every action leaving a trail — insight that withstands the questions of finance and compliance |
VIII. What This Means for the Industry
For provincial and municipal carriers, cross-province and cross-city settlement gains, for the first time, evidence flow by flow, class by class, province by province — and disagreements at the negotiating table can be converged by data.
For exchange operators, the traffic that is bypassing peering and paying for transit becomes a value they can proactively show their members, giving the appeal of peering a quantifiable proof.
For ISP agents and IDCs, customer-level flow attribution moves pricing from “one price per port” to “differentiated by flow direction,” so that profit is no longer quietly devoured by a handful of heavy-traffic customers.
For token operators, bandwidth cost can at last be accounted for customer by customer and region by region, just like compute cost — and the structure of gross margin becomes transparent and manageable for the first time.
The Deeper Meaning
Networks have never lacked data; what they lack is the ability to turn data into judgment. As AI turns compute into tokens, tokens into traffic, and traffic into cost, the scarcest asset in an operator’s hands is no longer ports and bandwidth, but insight into where the flows go — and the foresight and control that insight brings.
Watchdog is the answer WLStack Network, starting from its network DNA, offers this era: make the destination of every bit visible, make the value of every unit of bandwidth computable, and let every business decision stand on fact.
Seeing is where control begins.
2026 · WLStack Network